Estimated Value: $154,000 - $188,260
3
Beds
2
Baths
1,579
Sq Ft
$106/Sq Ft
Est. Value
About This Home
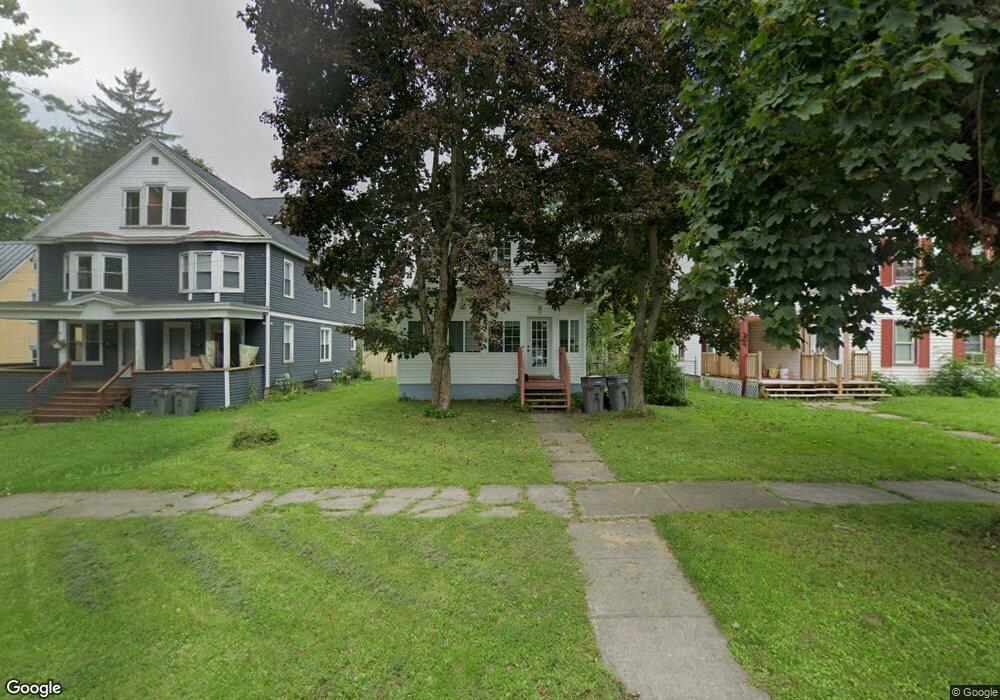
This home is located at 713 Kent St, Rome, NY 13440 and is currently estimated at $167,315, approximately $105 per square foot. 713 Kent St is a home located in Oneida County with nearby schools including Louis V. Denti Elementary School, George R. Staley Upper Elementary School, and Lyndon H. Strough Middle School.
Ownership History
Date
Name
Owned For
Owner Type
Purchase Details
Closed on
Oct 31, 2014
Sold by
Burress Joanne
Bought by
Healy Samuel
Current Estimated Value
Home Financials for this Owner
Home Financials are based on the most recent Mortgage that was taken out on this home.
Original Mortgage
$35,000
Outstanding Balance
$7,452
Interest Rate
4.17%
Mortgage Type
New Conventional
Estimated Equity
$159,863
Purchase Details
Closed on
Jun 12, 2009
Sold by
Homesales Inc
Bought by
Burress Joanne
Purchase Details
Closed on
Feb 23, 2009
Sold by
Renzi Maria
Bought by
Homesales Inc
Purchase Details
Closed on
Dec 16, 1996
Sold by
Lorusso Ralph and Lorusso Anna
Bought by
Renzi Maria J
Create a Home Valuation Report for This Property
The Home Valuation Report is an in-depth analysis detailing your home's value as well as a comparison with similar homes in the area
Home Values in the Area
Average Home Value in this Area
Purchase History
| Date | Buyer | Sale Price | Title Company |
|---|---|---|---|
| Healy Samuel | $35,000 | Charles W Engelbrecht | |
| Burress Joanne | $33,600 | Theresa Girouard | |
| Homesales Inc | $36,793 | Steven J Baum Pc | |
| Renzi Maria J | $47,500 | -- |
Source: Public Records
Mortgage History
| Date | Status | Borrower | Loan Amount |
|---|---|---|---|
| Open | Healy Samuel | $35,000 |
Source: Public Records
Tax History Compared to Growth
Tax History
| Year | Tax Paid | Tax Assessment Tax Assessment Total Assessment is a certain percentage of the fair market value that is determined by local assessors to be the total taxable value of land and additions on the property. | Land | Improvement |
|---|---|---|---|---|
| 2024 | $4,905 | $56,700 | $12,400 | $44,300 |
| 2023 | $1,604 | $56,700 | $12,400 | $44,300 |
| 2022 | $2,565 | $56,700 | $12,400 | $44,300 |
| 2021 | $2,486 | $56,700 | $12,400 | $44,300 |
| 2020 | $2,461 | $56,700 | $12,400 | $44,300 |
| 2019 | $566 | $56,700 | $12,400 | $44,300 |
| 2018 | $1,794 | $56,700 | $12,400 | $44,300 |
| 2017 | $1,740 | $56,700 | $12,400 | $44,300 |
| 2016 | $3,847 | $56,700 | $12,400 | $44,300 |
| 2015 | -- | $56,700 | $12,400 | $44,300 |
| 2014 | -- | $56,700 | $12,400 | $44,300 |
Source: Public Records
Map
Nearby Homes