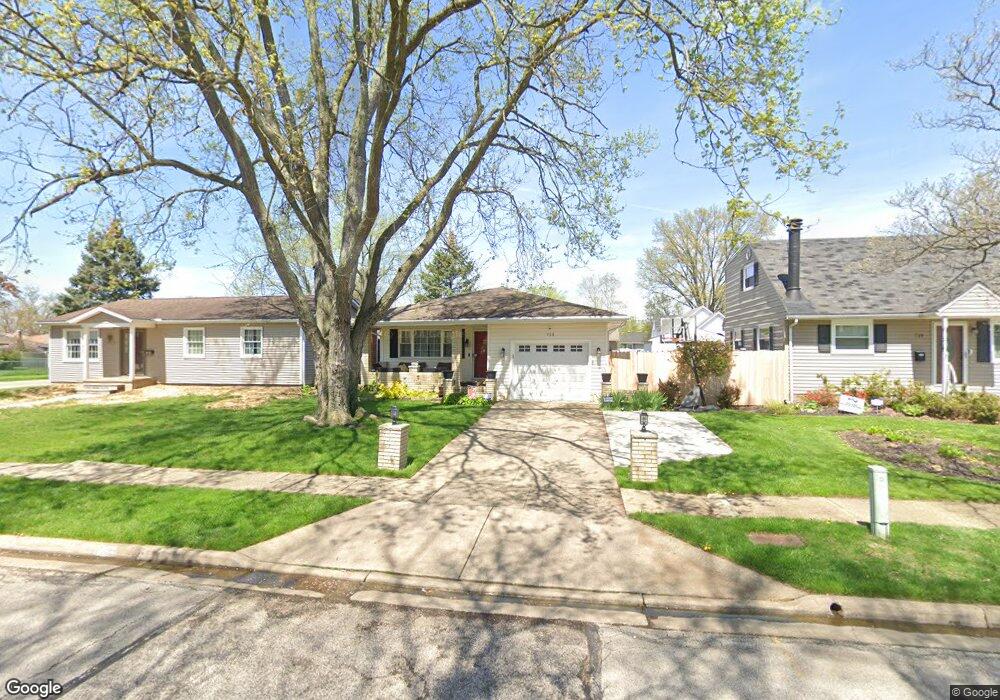
713 Lehigh Ave Cuyahoga Falls, OH 44221
Mud Brook NeighborhoodEstimated Value: $208,000 - $263,000
3
Beds
2
Baths
1,156
Sq Ft
$197/Sq Ft
Est. Value
About This Home
This home is located at 713 Lehigh Ave, Cuyahoga Falls, OH 44221 and is currently estimated at $227,282, approximately $196 per square foot. 713 Lehigh Ave is a home located in Summit County with nearby schools including Lincoln Elementary School, Roberts Middle School, and Cuyahoga Falls High School.
Ownership History
Date
Name
Owned For
Owner Type
Purchase Details
Closed on
Aug 4, 2009
Sold by
Shelton Shelah J
Bought by
Burns Stephen E and Burns Rebecca S
Current Estimated Value
Home Financials for this Owner
Home Financials are based on the most recent Mortgage that was taken out on this home.
Original Mortgage
$129,609
Outstanding Balance
$85,705
Interest Rate
5.49%
Mortgage Type
FHA
Estimated Equity
$141,577
Purchase Details
Closed on
Apr 9, 2002
Sold by
Kahooilihala Jeffrey D
Bought by
Shelton Shelah J
Purchase Details
Closed on
Jun 23, 2000
Sold by
Shelton Shelah
Bought by
Kahooilihala Jeffrey D and Shelton Shelah J
Home Financials for this Owner
Home Financials are based on the most recent Mortgage that was taken out on this home.
Original Mortgage
$57,002
Interest Rate
8.64%
Mortgage Type
FHA
Purchase Details
Closed on
Apr 10, 1999
Sold by
Weisend Betty L
Bought by
Shelton Shelah
Purchase Details
Closed on
Mar 30, 1999
Sold by
Shelton Frederick
Bought by
Weisend Betty L and Frederick H Shelton Revocable Living Tr
Create a Home Valuation Report for This Property
The Home Valuation Report is an in-depth analysis detailing your home's value as well as a comparison with similar homes in the area
Home Values in the Area
Average Home Value in this Area
Purchase History
| Date | Buyer | Sale Price | Title Company |
|---|---|---|---|
| Burns Stephen E | $132,000 | Cleveland Home Title | |
| Shelton Shelah J | -- | -- | |
| Kahooilihala Jeffrey D | -- | Real Estate Title | |
| Shelton Shelah | -- | Endress/Lawyers Title | |
| Weisend Betty L | -- | Endress/Lawyers Title |
Source: Public Records
Mortgage History
| Date | Status | Borrower | Loan Amount |
|---|---|---|---|
| Open | Burns Stephen E | $129,609 | |
| Previous Owner | Kahooilihala Jeffrey D | $57,002 |
Source: Public Records
Tax History Compared to Growth
Tax History
| Year | Tax Paid | Tax Assessment Tax Assessment Total Assessment is a certain percentage of the fair market value that is determined by local assessors to be the total taxable value of land and additions on the property. | Land | Improvement |
|---|---|---|---|---|
| 2025 | $3,192 | $59,133 | $12,450 | $46,683 |
| 2024 | $3,192 | $59,133 | $12,450 | $46,683 |
| 2023 | $3,192 | $59,133 | $12,450 | $46,683 |
| 2022 | $2,828 | $42,543 | $8,957 | $33,586 |
| 2021 | $2,828 | $42,543 | $8,957 | $33,586 |
| 2020 | $2,782 | $42,550 | $8,960 | $33,590 |
| 2019 | $2,969 | $41,360 | $8,600 | $32,760 |
| 2018 | $2,521 | $41,360 | $8,600 | $32,760 |
| 2017 | $2,320 | $41,360 | $8,600 | $32,760 |
| 2016 | $2,322 | $38,580 | $8,600 | $29,980 |
| 2015 | $2,320 | $38,580 | $8,600 | $29,980 |
| 2014 | $2,321 | $38,580 | $8,600 | $29,980 |
| 2013 | $2,385 | $39,990 | $8,600 | $31,390 |
Source: Public Records
Map
Nearby Homes
- Greenfield Plan at Miller's Landing
- Riverton Plan at Miller's Landing
- Woodside Plan at Miller's Landing
- Willwood Plan at Miller's Landing
- Westchester Plan at Miller's Landing
- Amberwood Plan at Miller's Landing
- Hilltop Plan at Miller's Landing
- 435 Roanoke Ave
- 455 Marguerite Ave
- 3320 Hudson Dr
- 419 Keenan Ave
- 306 Hollywood Ave
- 2886 Norwood St
- 2834 Norwood St
- 2890 Bailey Rd
- 2869 Lakewood Dr
- 2870 Kent Rd
- 2934 Silver Lake Blvd
- 2762 Bailey Rd
- 54 Washington Ave
- 719 Lehigh Ave
- 707 Lehigh Ave
- 725 Lehigh Ave
- 712 Orrville Ave
- 718 Orrville Ave
- 706 Orrville Ave
- 731 Lehigh Ave
- 724 Orrville Ave
- 653 Lehigh Ave
- 712 Lehigh Ave
- 718 Lehigh Ave
- 706 Lehigh Ave
- 730 Orrville Ave
- 724 Lehigh Ave
- 737 Lehigh Ave
- 680 Orrville Ave
- 730 Lehigh Ave
- 647 Lehigh Ave
- 736 Orrville Ave
- 648 Lehigh Ave