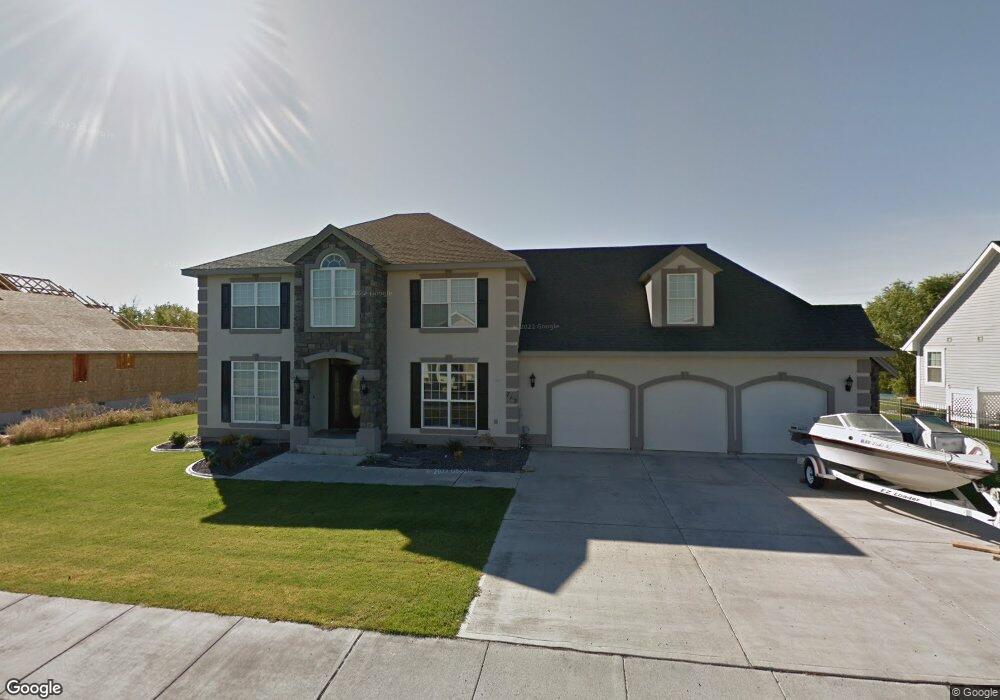
713 Lupine Dr S Moses Lake, WA 98837
Estimated Value: $762,000 - $871,000
4
Beds
3
Baths
3,343
Sq Ft
$242/Sq Ft
Est. Value
About This Home
This home is located at 713 Lupine Dr S, Moses Lake, WA 98837 and is currently estimated at $808,917, approximately $241 per square foot. 713 Lupine Dr S is a home located in Grant County with nearby schools including Peninsula Elementary School, Frontier Middle School, and Moses Lake High School.
Ownership History
Date
Name
Owned For
Owner Type
Purchase Details
Closed on
May 5, 2015
Sold by
Bernard Brandon and Bernard Megan
Bought by
Woods Cynthia D and Woods Janice F
Current Estimated Value
Purchase Details
Closed on
Jun 27, 2011
Sold by
Deutsche Bank Trust Company Americas
Bought by
Bernard Brandon and Bernard Megan
Purchase Details
Closed on
Dec 28, 2010
Sold by
Smith Larry L and Smith Jennifer M
Bought by
Deutsche Bank Trust Company Americas and Rali 2006Qa8
Purchase Details
Closed on
Jul 5, 2006
Sold by
Williams James Owen and Williams Susan Marie
Bought by
Smith Larry L and Smith Jennifer
Home Financials for this Owner
Home Financials are based on the most recent Mortgage that was taken out on this home.
Original Mortgage
$84,000
Interest Rate
6.57%
Mortgage Type
Unknown
Create a Home Valuation Report for This Property
The Home Valuation Report is an in-depth analysis detailing your home's value as well as a comparison with similar homes in the area
Home Values in the Area
Average Home Value in this Area
Purchase History
| Date | Buyer | Sale Price | Title Company |
|---|---|---|---|
| Woods Cynthia D | $355,000 | Stewart Title | |
| Bernard Brandon | $310,100 | Chicago Title Ins Co | |
| Deutsche Bank Trust Company Americas | $296,000 | Grant County Title | |
| Smith Larry L | $420,000 | Chicago Title Ins Co |
Source: Public Records
Mortgage History
| Date | Status | Borrower | Loan Amount |
|---|---|---|---|
| Previous Owner | Smith Larry L | $84,000 | |
| Previous Owner | Smith Larry L | $336,000 |
Source: Public Records
Tax History Compared to Growth
Tax History
| Year | Tax Paid | Tax Assessment Tax Assessment Total Assessment is a certain percentage of the fair market value that is determined by local assessors to be the total taxable value of land and additions on the property. | Land | Improvement |
|---|---|---|---|---|
| 2024 | $5,677 | $514,170 | $142,500 | $371,670 |
| 2023 | $5,185 | $420,905 | $77,500 | $343,405 |
| 2022 | $4,888 | $420,905 | $77,500 | $343,405 |
| 2021 | $5,002 | $420,905 | $77,500 | $343,405 |
| 2020 | $5,105 | $417,540 | $77,500 | $340,040 |
| 2019 | $5,492 | $417,860 | $80,200 | $337,660 |
| 2018 | $6,912 | $455,110 | $80,200 | $374,910 |
| 2017 | $5,573 | $382,035 | $80,200 | $301,835 |
| 2016 | $5,341 | $364,745 | $80,200 | $284,545 |
| 2013 | -- | $345,675 | $87,000 | $258,675 |
Source: Public Records
Map
Nearby Homes
- 800 Camas Place
- 805 Camas Place
- 612 S Laguna
- 951 Laguna Dr
- 939 Laguna Dr
- 1045 Laguna Dr
- 3435 Blue Heron Ln
- 4215 W Sandy Ct
- 4223 W Sandy Ct
- 4227 W Sandy Ct
- 4247 Sandy St
- 206 N Lessor Loop
- 4246 Sandy St
- 4259 Sandy St
- 4258 Sandy St
- 215 N Lessor Loop
- 221 N Lessor Loop
- 311 Sandy Loop
- 202 Sandy Loop
- 308 N Sandy Loop
- 713 Lupine Dr S
- 710 Lupine Dr
- 711 Lupine Dr S
- 714 Lupine Dr NE
- 715 Lupine Dr NE
- 712 Lupine Dr S
- 712 Lupine Dr S
- 714 Lupine Dr S
- 716 Lupine Dr NE
- 709 Lupine Dr S
- 700 Lupine Dr NE
- 717 Lupine Dr NE
- 607 Lupine Dr NE
- 801 Camas Place
- 718 Lupine Dr NE
- 605 Lupine Dr NE
- 802 Camas Place
- 707 Lupine Dr NE
- 705 Lupine Dr NE
- 605 Lupine Dr S