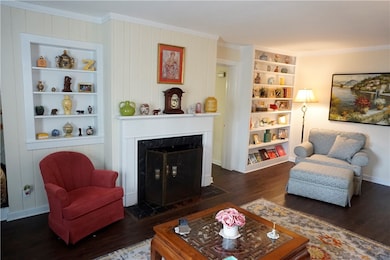
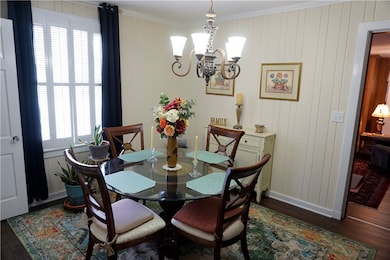
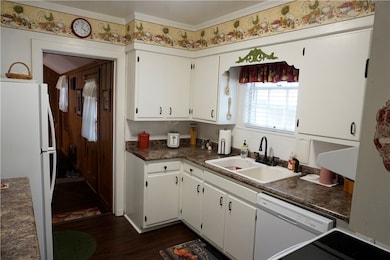
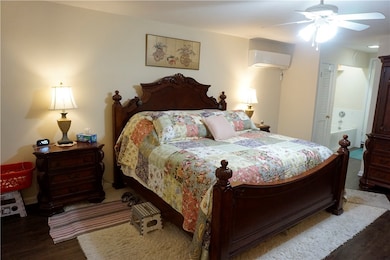
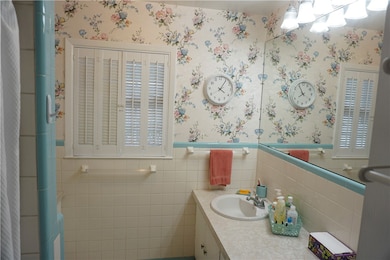
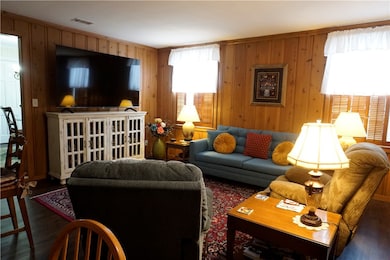
713 Magnolia Dr Waycross, GA 31501
Estimated payment $1,461/month
Total Views
9,543
3
Beds
2.5
Baths
2,144
Sq Ft
$121
Price per Sq Ft
About This Home
The home is easy to show, the owners do live here. Just let us know when would be a good time & we will set it up. Overnight notice is best. Thank you.
Home Details
Home Type
- Single Family
Est. Annual Taxes
- $1,177
Year Built
- Built in 1969
Lot Details
- 0.26 Acre Lot
Home Design
- 2,144 Sq Ft Home
Bedrooms and Bathrooms
- 3 Bedrooms
Listing and Financial Details
- Assessor Parcel Number WA2307 036
Map
Create a Home Valuation Report for This Property
The Home Valuation Report is an in-depth analysis detailing your home's value as well as a comparison with similar homes in the area
Home Values in the Area
Average Home Value in this Area
Tax History
| Year | Tax Paid | Tax Assessment Tax Assessment Total Assessment is a certain percentage of the fair market value that is determined by local assessors to be the total taxable value of land and additions on the property. | Land | Improvement |
|---|---|---|---|---|
| 2024 | $1,177 | $89,477 | $4,160 | $85,317 |
| 2023 | $1,201 | $55,785 | $3,134 | $52,651 |
| 2022 | $2,223 | $55,785 | $3,134 | $52,651 |
| 2021 | $1,450 | $43,246 | $3,134 | $40,112 |
| 2020 | $1,514 | $37,411 | $3,134 | $34,277 |
| 2019 | $722 | $36,196 | $3,134 | $33,062 |
| 2018 | $1,561 | $34,980 | $3,134 | $31,846 |
| 2017 | $518 | $34,980 | $3,134 | $31,846 |
| 2016 | $518 | $34,980 | $3,134 | $31,846 |
| 2015 | $521 | $34,979 | $3,134 | $31,846 |
| 2014 | $519 | $34,980 | $3,134 | $31,846 |
| 2013 | -- | $32,305 | $3,133 | $29,172 |
Source: Public Records
Property History
| Date | Event | Price | List to Sale | Price per Sq Ft | Prior Sale |
|---|---|---|---|---|---|
| 10/08/2025 10/08/25 | For Sale | $259,000 | +67.1% | $121 / Sq Ft | |
| 09/24/2021 09/24/21 | Sold | $155,000 | -1.9% | $72 / Sq Ft | View Prior Sale |
| 09/07/2021 09/07/21 | For Sale | $158,000 | -- | $74 / Sq Ft |
Source: Golden Isles Association of REALTORS®
Purchase History
| Date | Type | Sale Price | Title Company |
|---|---|---|---|
| Warranty Deed | $155,000 | -- | |
| Warranty Deed | $47,500 | -- | |
| Warranty Deed | -- | -- | |
| Warranty Deed | -- | -- |
Source: Public Records
Mortgage History
| Date | Status | Loan Amount | Loan Type |
|---|---|---|---|
| Previous Owner | $10,000,000 | New Conventional |
Source: Public Records
Source: Golden Isles Association of REALTORS®
MLS Number: 1657262
APN: WA2307-036
Nearby Homes
- 808 Satilla Blvd
- 903 Atlantic Ave
- 1101 Cherokee Dr
- 0 Saint Marys Dr Unit (TRACT 2 0.25 ACRES)
- 506 Magnolia Dr
- 511 Richmond Ave
- 707 Euclid Ave
- 1100 Atlantic Ave
- 1205 Dean Dr
- 907 Euclid Ave
- 1009 Baltimore Ave
- 1500 Saint Marys Dr
- 1009 Euclid Ave
- 1002 Baltimore Ave
- 1100 Euclid Ave
- 1001 Coral Rd
- 0 Goodwin St
- 807 College St
- 1204 Richmond Ave
- 706 Cherokee Cir

