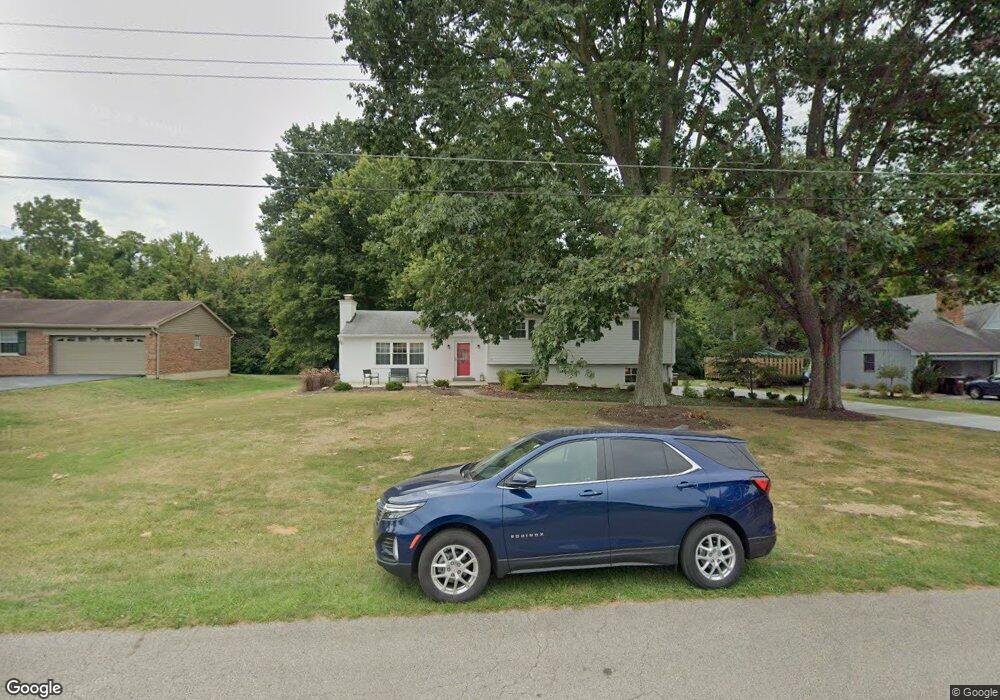
713 Maple Ridge Rd Milford, OH 45150
Estimated Value: $303,000 - $411,000
4
Beds
3
Baths
1,859
Sq Ft
$192/Sq Ft
Est. Value
About This Home
This home is located at 713 Maple Ridge Rd, Milford, OH 45150 and is currently estimated at $357,335, approximately $192 per square foot. 713 Maple Ridge Rd is a home located in Clermont County with nearby schools including Milford Senior High School, St. Andrew - St. Elizabeth Ann Seton School, and St. Mark's Lutheran School.
Ownership History
Date
Name
Owned For
Owner Type
Purchase Details
Closed on
Apr 8, 1999
Sold by
Keating Stephen
Bought by
Staubach Anthony R and Staubach Deborah G
Current Estimated Value
Home Financials for this Owner
Home Financials are based on the most recent Mortgage that was taken out on this home.
Original Mortgage
$128,134
Outstanding Balance
$32,176
Interest Rate
6.94%
Mortgage Type
FHA
Estimated Equity
$325,159
Purchase Details
Closed on
Jul 16, 1997
Sold by
Adam David A
Bought by
Keating Stephen
Home Financials for this Owner
Home Financials are based on the most recent Mortgage that was taken out on this home.
Original Mortgage
$116,375
Interest Rate
7.94%
Mortgage Type
Balloon
Purchase Details
Closed on
Mar 9, 1995
Sold by
Hopkins Rocio O
Bought by
Adam David A and Kim Audrey Y
Home Financials for this Owner
Home Financials are based on the most recent Mortgage that was taken out on this home.
Original Mortgage
$100,000
Interest Rate
7.25%
Mortgage Type
New Conventional
Purchase Details
Closed on
Jul 1, 1989
Create a Home Valuation Report for This Property
The Home Valuation Report is an in-depth analysis detailing your home's value as well as a comparison with similar homes in the area
Home Values in the Area
Average Home Value in this Area
Purchase History
| Date | Buyer | Sale Price | Title Company |
|---|---|---|---|
| Staubach Anthony R | $128,200 | -- | |
| Keating Stephen | $122,500 | -- | |
| Adam David A | $111,900 | -- | |
| -- | $86,500 | -- |
Source: Public Records
Mortgage History
| Date | Status | Borrower | Loan Amount |
|---|---|---|---|
| Open | Staubach Anthony R | $128,134 | |
| Previous Owner | Keating Stephen | $116,375 | |
| Previous Owner | Adam David A | $100,000 |
Source: Public Records
Tax History Compared to Growth
Tax History
| Year | Tax Paid | Tax Assessment Tax Assessment Total Assessment is a certain percentage of the fair market value that is determined by local assessors to be the total taxable value of land and additions on the property. | Land | Improvement |
|---|---|---|---|---|
| 2024 | $3,508 | $75,110 | $17,150 | $57,960 |
| 2023 | $3,544 | $75,110 | $17,150 | $57,960 |
| 2022 | $3,712 | $59,890 | $13,650 | $46,240 |
| 2021 | $3,716 | $59,890 | $13,650 | $46,240 |
| 2020 | $3,565 | $59,890 | $13,650 | $46,240 |
| 2019 | $3,391 | $54,080 | $13,550 | $40,530 |
| 2018 | $3,290 | $52,440 | $13,550 | $38,890 |
| 2017 | $2,989 | $52,440 | $13,550 | $38,890 |
| 2016 | $2,989 | $43,330 | $11,200 | $32,130 |
| 2015 | $2,794 | $43,330 | $11,200 | $32,130 |
| 2014 | $2,794 | $43,330 | $11,200 | $32,130 |
| 2013 | $2,825 | $42,490 | $10,500 | $31,990 |
Source: Public Records
Map
Nearby Homes
- 772 Price Knoll Ln
- 5880 Stonebridge Cir
- 221 Miami Lakes Dr
- 5884 Stonebridge Cir
- 5763 Price Rd
- 5 White Water Way
- 732 St Rt 28
- 5612 Flagstone Way
- 18 Big Oak Ln
- 957 Tarragon Ln
- 5633 Happy Hollow Rd
- 12 Valley View Cir
- 826 Ohio 131
- 5897 Cook Rd
- 977 Newberry Ave
- 764 Forest Ave
- 250 Postoak Ln
- 1524 Summerview Ln
- 1514 Summerview Ln
- 5870 Parkview Ln
- 715 Maple Ridge Rd
- 709 Maple Ridge Rd
- 719 Maple Ridge Rd
- 707 Maple Ridge Rd
- 714 Maple Ridge Rd
- 710 Maple Ridge Rd
- 718 Maple Ridge Rd
- 705 Maple Ridge Rd
- 705 Maple Ridge Rd
- 721 Maple Ridge Rd
- 706 Maple Ridge Rd
- 722 Maple Ridge Rd
- 713 Pine Ridge Rd
- 717 Pine Ridge Rd
- 709 Pine Ridge Rd
- 725 Maple Ridge Rd
- 726 Maple Ridge Rd
- 721 Pine Ridge Rd
- 729 Maple Ridge Rd
- 5887 Thorny Ridge