Estimated Value: $212,574 - $261,000
--
Bed
--
Bath
1,813
Sq Ft
$133/Sq Ft
Est. Value
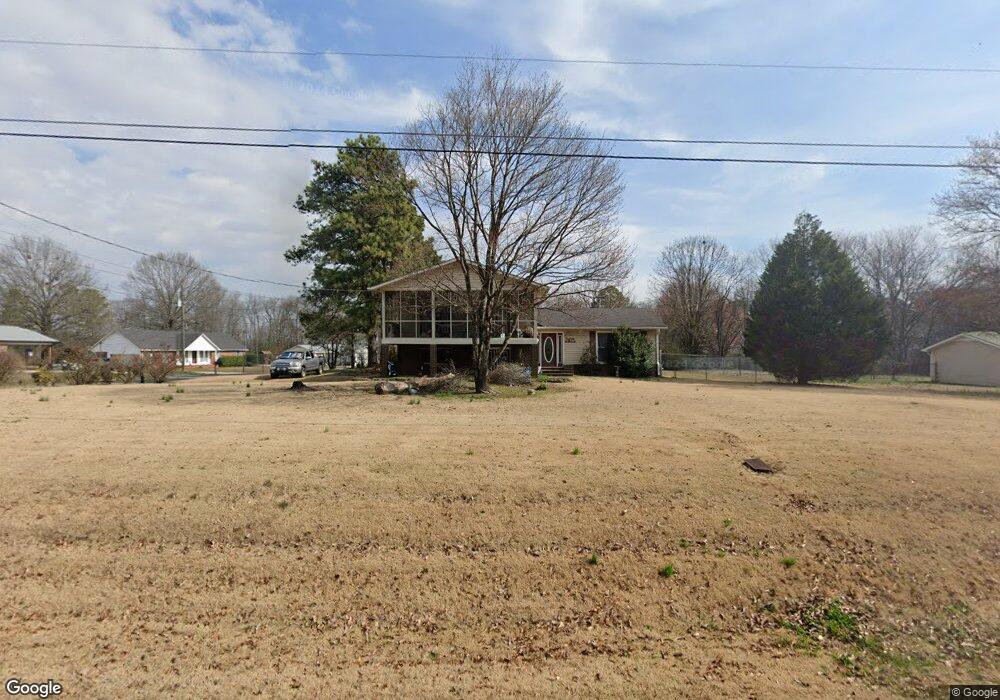
About This Home
This home is located at 713 Mays Bridge Rd SW, Rome, GA 30165 and is currently estimated at $240,644, approximately $132 per square foot. 713 Mays Bridge Rd SW is a home located in Floyd County with nearby schools including Coosa Middle School and Coosa High School.
Ownership History
Date
Name
Owned For
Owner Type
Purchase Details
Closed on
Jul 14, 2017
Sold by
Castleman Christopher
Bought by
Castleman Christopher and Castleman Brianna
Current Estimated Value
Home Financials for this Owner
Home Financials are based on the most recent Mortgage that was taken out on this home.
Original Mortgage
$111,547
Outstanding Balance
$92,728
Interest Rate
3.91%
Mortgage Type
VA
Estimated Equity
$147,916
Purchase Details
Closed on
Dec 18, 1987
Sold by
Wall Billy F and Wall Evette F
Bought by
Lance Gary Leon and Lance Kimberly
Purchase Details
Closed on
Oct 17, 1974
Sold by
Benton George and Benton Jack
Bought by
Wall Billy F and Wall Evette F
Purchase Details
Closed on
Jan 21, 1974
Sold by
Benton George
Bought by
Benton George and Benton Jack
Purchase Details
Closed on
Jun 16, 1972
Bought by
Benton George
Create a Home Valuation Report for This Property
The Home Valuation Report is an in-depth analysis detailing your home's value as well as a comparison with similar homes in the area
Home Values in the Area
Average Home Value in this Area
Purchase History
| Date | Buyer | Sale Price | Title Company |
|---|---|---|---|
| Castleman Christopher | -- | -- | |
| Castleman Christopher | $109,200 | -- | |
| Lance Gary Leon | $46,500 | -- | |
| Wall Billy F | -- | -- | |
| Benton George | -- | -- | |
| Benton George | $36,800 | -- |
Source: Public Records
Mortgage History
| Date | Status | Borrower | Loan Amount |
|---|---|---|---|
| Open | Castleman Christopher | $111,547 | |
| Closed | Castleman Christopher | $111,547 |
Source: Public Records
Tax History Compared to Growth
Tax History
| Year | Tax Paid | Tax Assessment Tax Assessment Total Assessment is a certain percentage of the fair market value that is determined by local assessors to be the total taxable value of land and additions on the property. | Land | Improvement |
|---|---|---|---|---|
| 2024 | $1,779 | $79,810 | $5,870 | $73,940 |
| 2023 | $1,786 | $77,740 | $5,336 | $72,404 |
| 2022 | $1,580 | $64,354 | $4,361 | $59,993 |
| 2021 | $1,259 | $45,728 | $3,976 | $41,752 |
| 2020 | $1,232 | $43,679 | $3,457 | $40,222 |
| 2019 | $1,264 | $42,070 | $3,457 | $38,613 |
| 2018 | $1,210 | $40,215 | $3,293 | $36,922 |
| 2017 | $1,105 | $36,662 | $3,049 | $33,613 |
| 2016 | $968 | $35,908 | $3,040 | $32,868 |
| 2015 | $949 | $35,908 | $3,040 | $32,868 |
| 2014 | $949 | $35,908 | $3,040 | $32,868 |
Source: Public Records
Map
Nearby Homes
- 5 Red Fox Dr SW
- 26 Red Fox Dr SW
- 458 Kraftsman Rd SW
- 10 Eagle Dr NW
- 43 Brownlow Dr NW
- 8 Kayla Dr NW
- 0 Alabama Hwy Unit 7494552
- 0 Alabama Hwy Unit 7635346
- 0 Alabama Hwy Unit 10590171
- 3 Cedar Ln NW
- 48 Atwood Dr NW
- 33 Cedar Ln NW
- 63 Highlander Trail SW
- 48 Highlander Trail SW
- 14 Bryan Springs Rd SW
- 0 Ausburn Rd SW Unit 10611100
- 293 N Avery Rd NW
- 3 SW Highlander Trail SW
- 22 Wet Oak Dr NW
- 0 Barker Rd SW Unit 10651788
- 40 Kelli Dr SW
- 30 Kelli Dr SW
- 20 Kelli Dr SW
- 725 Mays Bridge Rd SW
- 2 Kelli Dr SW
- 8 Kelli Dr SW
- 4 Kelli Dr SW
- 1 Kelli Dr SW
- 2 Red Fox Dr SW
- 724 Mays Bridge Rd SW
- 6 Kelli Dr SW
- 673 Mays Bridge Rd SW
- 3 Kelli Dr SW
- 4 Red Fox Dr SW
- 5 Kelli Dr SW
- 6 Red Fox Dr SW
- 7 Kelli Dr SW
- 763 Mays Bridge Rd SW
- 763 Mays Bridge Rd SW
- 3 Red Fox Dr SW