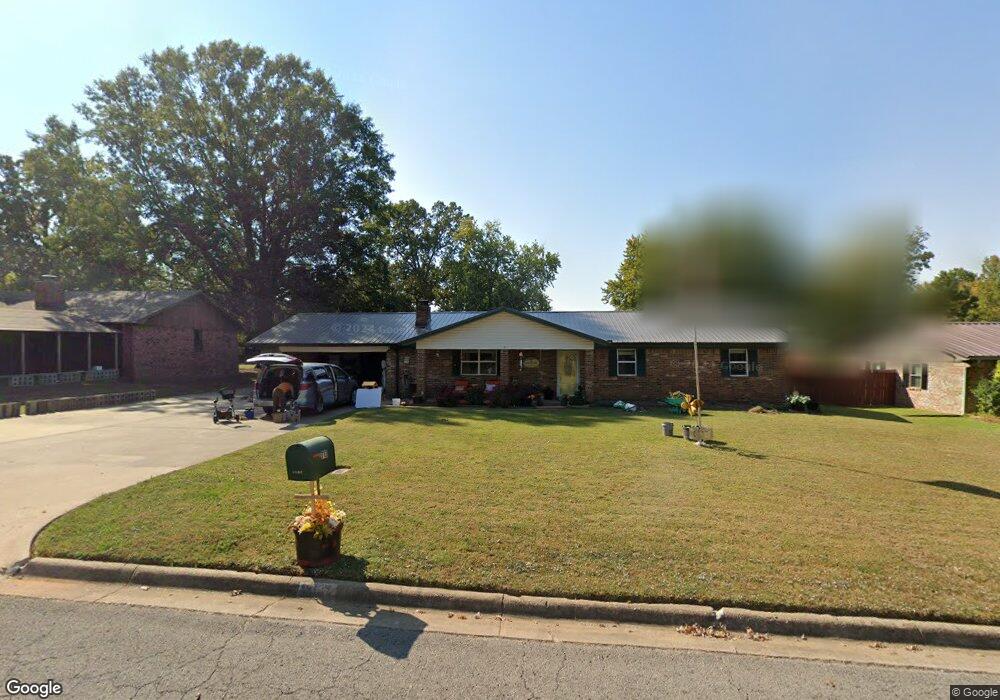
713 Melba Denton Ln Sallisaw, OK 74955
Estimated Value: $168,000 - $214,000
3
Beds
2
Baths
2,044
Sq Ft
$94/Sq Ft
Est. Value
About This Home
This home is located at 713 Melba Denton Ln, Sallisaw, OK 74955 and is currently estimated at $192,327, approximately $94 per square foot. 713 Melba Denton Ln is a home located in Sequoyah County with nearby schools including Liberty Elementary School, Eastside Elementary School, and Sallisaw Middle School.
Ownership History
Date
Name
Owned For
Owner Type
Purchase Details
Closed on
Apr 11, 2024
Sold by
George Dan
Bought by
Kibbe Marilyn
Current Estimated Value
Purchase Details
Closed on
Sep 1, 2020
Sold by
Wann Alvin
Bought by
Victory Johnny and Victory Charla
Purchase Details
Closed on
Oct 10, 2008
Sold by
Victory Johhny Allen and Victory Charla
Bought by
Victory Johhnny Allen and Victory Charla
Home Financials for this Owner
Home Financials are based on the most recent Mortgage that was taken out on this home.
Original Mortgage
$132,488
Interest Rate
6.35%
Mortgage Type
VA
Purchase Details
Closed on
Nov 24, 1999
Sold by
Talbott Robert and Talbott Dana
Bought by
Braboy Keith B
Purchase Details
Closed on
Jun 23, 1993
Sold by
Ellington Jack
Bought by
Talbott Robert Eric
Create a Home Valuation Report for This Property
The Home Valuation Report is an in-depth analysis detailing your home's value as well as a comparison with similar homes in the area
Home Values in the Area
Average Home Value in this Area
Purchase History
| Date | Buyer | Sale Price | Title Company |
|---|---|---|---|
| Kibbe Marilyn | -- | None Listed On Document | |
| Victory Johnny | $40,000 | None Available | |
| Victory Johhnny Allen | -- | None Available | |
| Victory Johnny Allen | $130,000 | None Available | |
| Braboy Keith B | $84,000 | -- | |
| Talbott Robert Eric | $60,000 | -- |
Source: Public Records
Mortgage History
| Date | Status | Borrower | Loan Amount |
|---|---|---|---|
| Previous Owner | Victory Johnny Allen | $132,488 |
Source: Public Records
Tax History Compared to Growth
Tax History
| Year | Tax Paid | Tax Assessment Tax Assessment Total Assessment is a certain percentage of the fair market value that is determined by local assessors to be the total taxable value of land and additions on the property. | Land | Improvement |
|---|---|---|---|---|
| 2024 | -- | $14,693 | $1,980 | $12,713 |
| 2023 | $0 | $14,264 | $1,980 | $12,284 |
| 2022 | $0 | $13,849 | $1,980 | $11,869 |
| 2021 | $1,158 | $13,849 | $1,980 | $11,869 |
| 2020 | $1,158 | $13,849 | $1,980 | $11,869 |
| 2019 | $1,158 | $14,223 | $1,980 | $12,243 |
| 2018 | $0 | $13,882 | $1,540 | $12,342 |
| 2017 | $0 | $14,069 | $1,540 | $12,529 |
| 2016 | $1,199 | $14,443 | $1,540 | $12,903 |
| 2015 | $1,208 | $14,300 | $1,540 | $12,760 |
| 2014 | $1,207 | $14,300 | $1,430 | $12,870 |
Source: Public Records
Map
Nearby Homes
- 414 N Dogwood St
- 402 N Dogwood St
- 406 N Dogwood St
- TBD Mitchell St
- 320 N Dogwood St
- 60 N Redwood Cir
- 1122 Green St
- 412 Ridge Dr
- 611 E Wilshire Blvd
- 701 E Chickasaw Ave
- 830 E Chickasaw Place
- 1408 Lessley Ln
- 409 E Choctaw Ave
- 831 E Mary Ave
- 0 Rural Route Unit 2535327
- 703 E Ida Ave
- 1605 Preakness Place
- 300 S Fryar Dr
- 1705 E Fryar Dr
- 204 S Mulberry St
- 705 Melba Denton Ln
- 719 Melba Denton Ln
- 712 N Dogwood St
- 712 Melba Denton Ln
- 712 Melba Denton Ln
- 712 Melba Denton Ln
- 712 Melba Denton Ln
- 712 Melba Denton Ln
- 712 Melba Denton Ln
- 712 Melba Denton Ln
- 718 N Dogwood St
- 1104 Alex Denton Dr
- 704 Melba Denton Ln
- 619 Melba Denton Ln
- 1007 Alex Denton Dr
- 618 Melba Denton Ln
- 615 Melba Denton Ln
- 1003 Alex Denton Dr
- 612 N Dogwood St
- 804 Melba Denton Ln