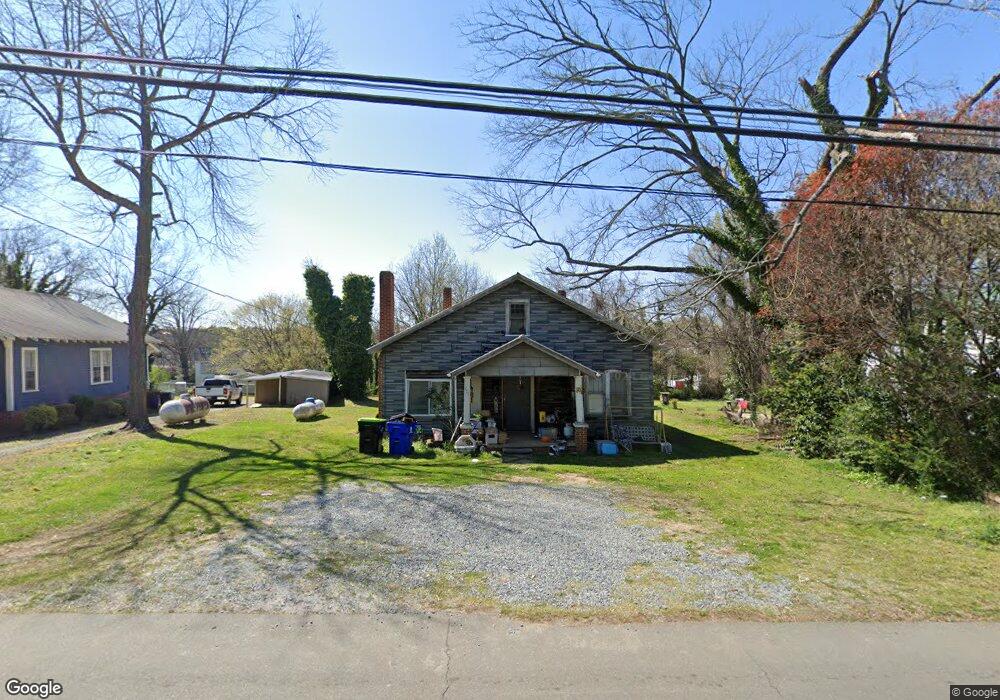
713 N 3rd Ave Siler City, NC 27344
Estimated Value: $93,000 - $205,000
3
Beds
2
Baths
1,216
Sq Ft
$113/Sq Ft
Est. Value
About This Home
This home is located at 713 N 3rd Ave, Siler City, NC 27344 and is currently estimated at $136,928, approximately $112 per square foot. 713 N 3rd Ave is a home located in Chatham County with nearby schools including Virginia Cross Elementary School, Chatham Middle, and Jordan Matthews High.
Ownership History
Date
Name
Owned For
Owner Type
Purchase Details
Closed on
Mar 23, 2010
Sold by
Moody Charlie Wayne
Bought by
Moody Rachel May
Current Estimated Value
Purchase Details
Closed on
Aug 6, 1998
Bought by
Poole Mary Catherine Aka and Moody Mary Catherine
Create a Home Valuation Report for This Property
The Home Valuation Report is an in-depth analysis detailing your home's value as well as a comparison with similar homes in the area
Home Values in the Area
Average Home Value in this Area
Purchase History
| Date | Buyer | Sale Price | Title Company |
|---|---|---|---|
| Moody Rachel May | -- | None Available | |
| Poole Mary Catherine Aka | -- | -- |
Source: Public Records
Tax History Compared to Growth
Tax History
| Year | Tax Paid | Tax Assessment Tax Assessment Total Assessment is a certain percentage of the fair market value that is determined by local assessors to be the total taxable value of land and additions on the property. | Land | Improvement |
|---|---|---|---|---|
| 2025 | $1,000 | $65,299 | $14,784 | $50,515 |
| 2024 | $1,000 | $46,129 | $14,080 | $32,049 |
| 2023 | $292 | $46,129 | $14,080 | $32,049 |
| 2022 | $556 | $46,129 | $14,080 | $32,049 |
| 2021 | $556 | $46,129 | $14,080 | $32,049 |
| 2020 | $422 | $34,898 | $12,500 | $22,398 |
| 2019 | $422 | $34,898 | $12,500 | $22,398 |
| 2018 | $397 | $34,898 | $12,500 | $22,398 |
| 2017 | $397 | $34,898 | $12,500 | $22,398 |
| 2016 | $389 | $34,898 | $12,500 | $22,398 |
| 2015 | $385 | $34,898 | $12,500 | $22,398 |
| 2014 | $385 | $34,898 | $12,500 | $22,398 |
| 2013 | -- | $34,898 | $12,500 | $22,398 |
Source: Public Records
Map
Nearby Homes
- 409 E 10th St
- 1707 N Chatham Ave
- TBD E 3rd St
- 803 Woodland Dr
- 806 Cliftwood Dr
- 00 U S Highway 64
- 17880 U S Highway 64
- 519 W Raleigh St
- 1004 Candlewood Cir
- 1501 Duet Dr
- Tbd W 3rd St
- 303 W Dolphin St
- 1007 Driftwood Dr
- 707 Lakewood Dr
- 513 W Glendale St
- 701 S Chatham Ave
- 0 W 3rd St
- 726 S 2nd Ave
- 1306 Sunset Dr
- 128 Olde Manor Ct