Estimated Value: $149,000 - $162,813
3
Beds
1
Bath
1,036
Sq Ft
$151/Sq Ft
Est. Value
About This Home
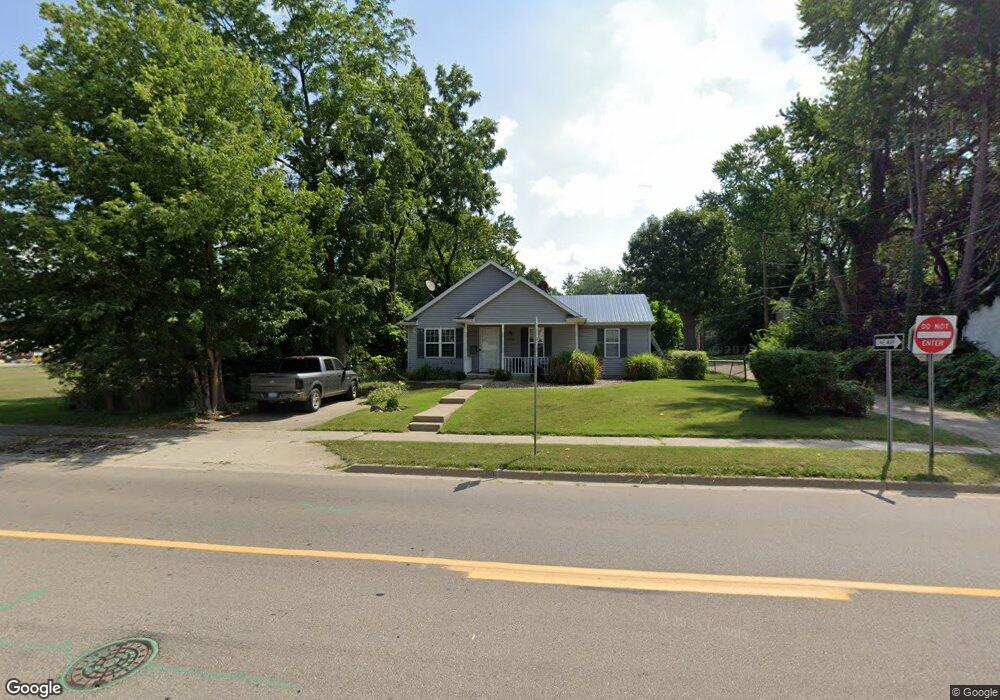
This home is located at 713 N 5th St, Niles, MI 49120 and is currently estimated at $156,453, approximately $151 per square foot. 713 N 5th St is a home located in Berrien County with nearby schools including Ballard Elementary School, Oak Manor Sixth Grade Center, and Ring Lardner Middle School.
Ownership History
Date
Name
Owned For
Owner Type
Purchase Details
Closed on
May 28, 2004
Sold by
The Estate Of Doris Ann Sales
Bought by
Sales Eric C
Current Estimated Value
Purchase Details
Closed on
Oct 11, 2001
Purchase Details
Closed on
Apr 14, 2000
Purchase Details
Closed on
Mar 31, 1998
Purchase Details
Closed on
Nov 15, 1997
Purchase Details
Closed on
Dec 31, 1993
Purchase Details
Closed on
Feb 13, 1991
Purchase Details
Closed on
Dec 1, 1985
Purchase Details
Closed on
Nov 25, 1985
Create a Home Valuation Report for This Property
The Home Valuation Report is an in-depth analysis detailing your home's value as well as a comparison with similar homes in the area
Home Values in the Area
Average Home Value in this Area
Purchase History
| Date | Buyer | Sale Price | Title Company |
|---|---|---|---|
| Sales Eric C | -- | -- | |
| -- | $71,500 | -- | |
| -- | $9,000 | -- | |
| -- | -- | -- | |
| -- | $500 | -- | |
| -- | $100 | -- | |
| -- | $13,800 | -- | |
| -- | $15,500 | -- | |
| -- | $15,500 | -- |
Source: Public Records
Tax History Compared to Growth
Tax History
| Year | Tax Paid | Tax Assessment Tax Assessment Total Assessment is a certain percentage of the fair market value that is determined by local assessors to be the total taxable value of land and additions on the property. | Land | Improvement |
|---|---|---|---|---|
| 2025 | $1,685 | $79,300 | $0 | $0 |
| 2024 | $1,328 | $78,200 | $0 | $0 |
| 2023 | $1,273 | $72,100 | $0 | $0 |
| 2022 | $1,212 | $44,900 | $0 | $0 |
| 2021 | $1,485 | $41,200 | $3,000 | $38,200 |
| 2020 | $1,469 | $40,000 | $0 | $0 |
| 2019 | $1,410 | $37,000 | $0 | $0 |
| 2018 | $1,363 | $37,000 | $0 | $0 |
| 2017 | $1,340 | $43,700 | $0 | $0 |
| 2016 | $1,312 | $34,900 | $0 | $0 |
| 2015 | $1,434 | $43,700 | $0 | $0 |
| 2014 | $1,122 | $38,200 | $0 | $0 |
Source: Public Records
Map
Nearby Homes