Estimated Value: $383,569 - $415,000
4
Beds
2
Baths
2,179
Sq Ft
$184/Sq Ft
Est. Value
About This Home
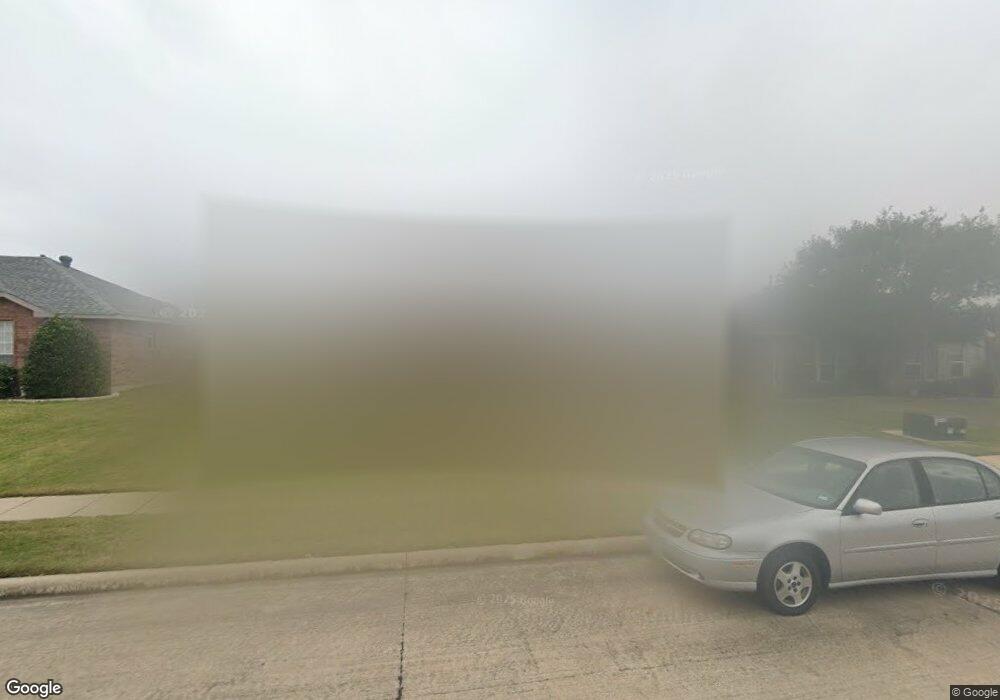
This home is located at 713 Nickelville Ln, Wylie, TX 75098 and is currently estimated at $400,392, approximately $183 per square foot. 713 Nickelville Ln is a home located in Collin County with nearby schools including T.F. Birmingham Elementary School, Frank Mcmillan Junior High School, and Davis Intermediate School.
Ownership History
Date
Name
Owned For
Owner Type
Purchase Details
Closed on
Jul 15, 2021
Sold by
Howard Debra A
Bought by
Miars Tammy
Current Estimated Value
Home Financials for this Owner
Home Financials are based on the most recent Mortgage that was taken out on this home.
Original Mortgage
$196,000
Interest Rate
3.01%
Mortgage Type
New Conventional
Purchase Details
Closed on
Apr 17, 2019
Sold by
Sparlin James and Sparlin Rebecca
Bought by
Howard Debra A
Home Financials for this Owner
Home Financials are based on the most recent Mortgage that was taken out on this home.
Original Mortgage
$231,750
Interest Rate
4.2%
Mortgage Type
New Conventional
Purchase Details
Closed on
Nov 30, 2000
Sold by
Ray Morris Homes Inc
Bought by
Sparlin James and Sparlin Rebecca
Home Financials for this Owner
Home Financials are based on the most recent Mortgage that was taken out on this home.
Original Mortgage
$143,786
Interest Rate
7.72%
Create a Home Valuation Report for This Property
The Home Valuation Report is an in-depth analysis detailing your home's value as well as a comparison with similar homes in the area
Home Values in the Area
Average Home Value in this Area
Purchase History
| Date | Buyer | Sale Price | Title Company |
|---|---|---|---|
| Miars Tammy | -- | None Listed On Document | |
| Howard Debra A | -- | Old Republic Title | |
| Sparlin James | -- | -- |
Source: Public Records
Mortgage History
| Date | Status | Borrower | Loan Amount |
|---|---|---|---|
| Previous Owner | Miars Tammy | $196,000 | |
| Previous Owner | Howard Debra A | $231,750 | |
| Previous Owner | Sparlin James | $143,786 |
Source: Public Records
Tax History Compared to Growth
Tax History
| Year | Tax Paid | Tax Assessment Tax Assessment Total Assessment is a certain percentage of the fair market value that is determined by local assessors to be the total taxable value of land and additions on the property. | Land | Improvement |
|---|---|---|---|---|
| 2025 | $6,374 | $421,896 | $95,000 | $326,896 |
| 2024 | $6,374 | $416,021 | $95,000 | $293,640 |
| 2023 | $6,374 | $389,000 | $85,000 | $304,000 |
| 2022 | $7,766 | $354,000 | $85,000 | $269,000 |
| 2021 | $6,828 | $290,216 | $70,000 | $220,216 |
| 2020 | $6,714 | $270,405 | $55,000 | $215,405 |
| 2019 | $6,357 | $241,893 | $55,000 | $203,000 |
| 2018 | $5,922 | $219,903 | $55,000 | $196,637 |
| 2017 | $5,384 | $220,419 | $50,000 | $170,419 |
| 2016 | $5,050 | $207,998 | $40,000 | $167,998 |
| 2015 | $3,854 | $186,158 | $35,000 | $151,158 |
Source: Public Records
Map
Nearby Homes
- 708 Andersonville Ln
- 115 Pullman Place
- 315 Celia Cir
- 107 N Winding Oaks Dr
- 314 Stephanie St
- 913 Chickesaw Ln
- 310 Austin Ave
- 410 Oxford Dr
- 420 W Oak St
- 907 Carlton Rd
- Crest Plan at The Apollo
- Nova Plan at The Apollo
- Solis Plan at The Apollo
- 404 W Jefferson St
- 908 Greene Way
- 902 Greene Way
- 1422 Mars Lander Ln
- 1003 Ann Dr
- 1426 Mars Lander Ln
- 1430 Mars Lander Ln
- 711 Nickelville Ln
- 715 Nickelville Ln
- 709 Nickelville Ln
- 710 Georgetown Dr
- 708 Georgetown Dr
- 712 Georgetown Dr
- 201 Arborview Dr
- 707 Nickelville Ln
- 706 Georgetown Dr
- 714 Georgetown Dr
- 704 Georgetown Dr
- 203 Arborview Dr
- 716 Georgetown Dr
- 705 Nickelville Ln
- 708 Nickelville Ln
- 702 Georgetown Dr
- 718 Georgetown Dr
- 205 Arborview Dr
- 706 Nickelville Ln
- 707 Georgetown Dr