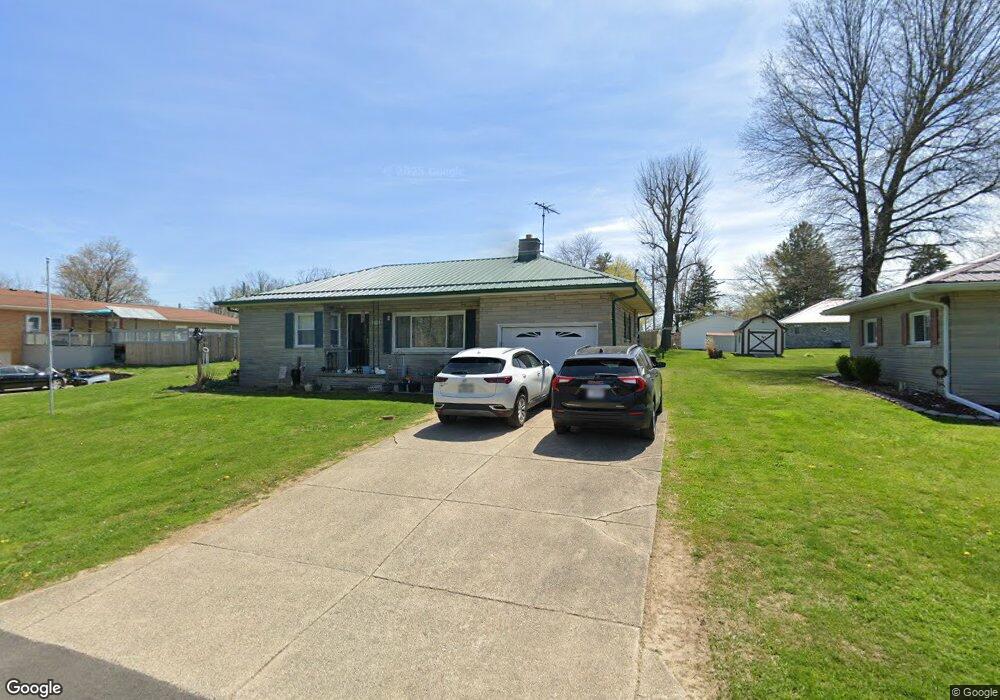
713 Race St Frankton, IN 46044
Estimated Value: $155,000 - $188,000
2
Beds
2
Baths
952
Sq Ft
$176/Sq Ft
Est. Value
About This Home
This home is located at 713 Race St, Frankton, IN 46044 and is currently estimated at $167,250, approximately $175 per square foot. 713 Race St is a home located in Madison County with nearby schools including Frankton Elementary School and Frankton Junior/Senior High School.
Ownership History
Date
Name
Owned For
Owner Type
Purchase Details
Closed on
May 29, 2013
Sold by
Sanders Brett
Bought by
Mccord Joyce A
Current Estimated Value
Home Financials for this Owner
Home Financials are based on the most recent Mortgage that was taken out on this home.
Original Mortgage
$68,732
Outstanding Balance
$47,860
Interest Rate
3.25%
Mortgage Type
FHA
Estimated Equity
$119,390
Purchase Details
Closed on
Jan 7, 2010
Sold by
Bank Of New York
Bought by
Sanders Brett
Home Financials for this Owner
Home Financials are based on the most recent Mortgage that was taken out on this home.
Original Mortgage
$60,877
Interest Rate
5.25%
Mortgage Type
FHA
Purchase Details
Closed on
Feb 25, 2005
Sold by
Hayes Dallas D and Hayes Dorcas E
Bought by
Flatford Nichole
Home Financials for this Owner
Home Financials are based on the most recent Mortgage that was taken out on this home.
Original Mortgage
$90,000
Interest Rate
8.55%
Mortgage Type
Adjustable Rate Mortgage/ARM
Create a Home Valuation Report for This Property
The Home Valuation Report is an in-depth analysis detailing your home's value as well as a comparison with similar homes in the area
Home Values in the Area
Average Home Value in this Area
Purchase History
| Date | Buyer | Sale Price | Title Company |
|---|---|---|---|
| Mccord Joyce A | -- | -- | |
| Sanders Brett | -- | -- | |
| Flatford Nichole | $90,000 | -- |
Source: Public Records
Mortgage History
| Date | Status | Borrower | Loan Amount |
|---|---|---|---|
| Open | Mccord Joyce A | $68,732 | |
| Previous Owner | Sanders Brett | $60,877 | |
| Previous Owner | Flatford Nichole | $90,000 |
Source: Public Records
Tax History Compared to Growth
Tax History
| Year | Tax Paid | Tax Assessment Tax Assessment Total Assessment is a certain percentage of the fair market value that is determined by local assessors to be the total taxable value of land and additions on the property. | Land | Improvement |
|---|---|---|---|---|
| 2025 | $1,145 | $114,500 | $10,800 | $103,700 |
| 2024 | $1,145 | $114,500 | $10,800 | $103,700 |
| 2023 | $1,120 | $104,800 | $10,300 | $94,500 |
| 2022 | $1,034 | $104,500 | $9,800 | $94,700 |
| 2021 | $947 | $98,400 | $9,800 | $88,600 |
| 2020 | $934 | $94,500 | $9,300 | $85,200 |
| 2019 | $854 | $92,200 | $9,300 | $82,900 |
| 2018 | $736 | $82,900 | $9,300 | $73,600 |
| 2017 | $672 | $81,700 | $9,300 | $72,400 |
| 2016 | $658 | $81,700 | $9,300 | $72,400 |
| 2014 | $643 | $80,300 | $9,300 | $71,000 |
| 2013 | $643 | $80,300 | $9,300 | $71,000 |
Source: Public Records
Map
Nearby Homes