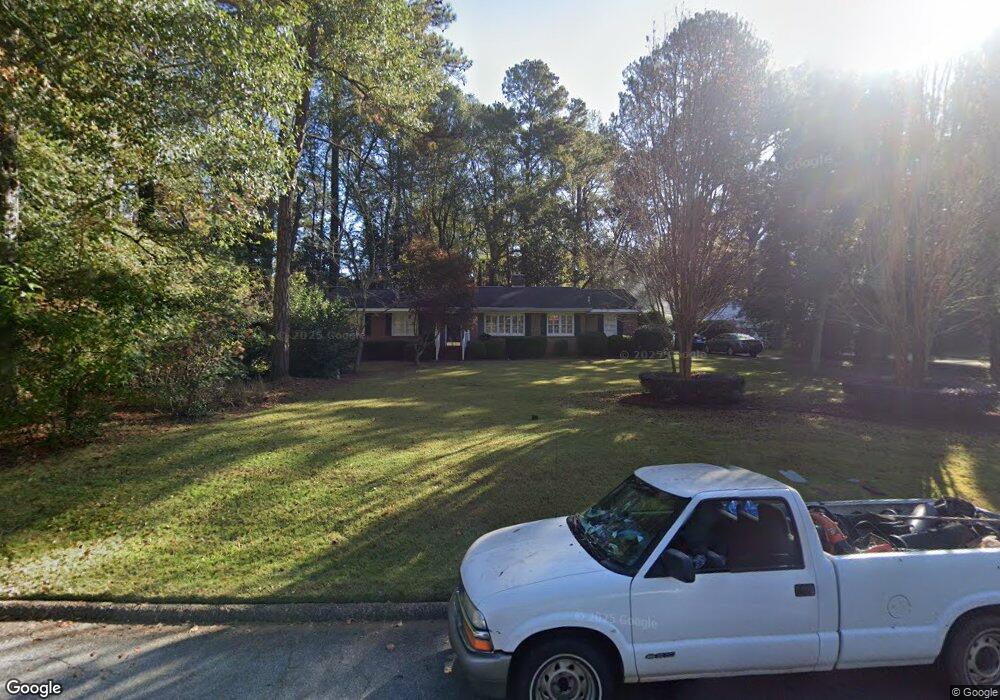
713 Ridgecrest Rd Lagrange, GA 30240
Estimated Value: $289,464 - $330,000
3
Beds
2
Baths
1,862
Sq Ft
$165/Sq Ft
Est. Value
About This Home
This home is located at 713 Ridgecrest Rd, Lagrange, GA 30240 and is currently estimated at $308,116, approximately $165 per square foot. 713 Ridgecrest Rd is a home located in Troup County with nearby schools including Hollis Hand Elementary School, Ethel W. Kight Elementary School, and Franklin Forest Elementary School.
Ownership History
Date
Name
Owned For
Owner Type
Purchase Details
Closed on
Oct 25, 2002
Sold by
Templeton Richard and Templeton Christi
Bought by
Seay John D
Current Estimated Value
Purchase Details
Closed on
Dec 3, 2001
Sold by
Julie K Adams
Bought by
Templeton Richard and Templeton Christi
Purchase Details
Closed on
Sep 7, 1999
Sold by
Yates Unlimited Inc
Bought by
Julie K Adams
Purchase Details
Closed on
May 24, 1999
Sold by
Realtor Jane L and Realtor Sale
Bought by
Yates Unlimited Inc
Purchase Details
Closed on
Apr 2, 1996
Sold by
Walters Robert
Bought by
Realtor Jane L and Realtor Sale
Purchase Details
Closed on
May 9, 1990
Sold by
Charles G Gibson
Bought by
Walters Robert
Purchase Details
Closed on
Jul 17, 1978
Sold by
Charles G Gibson
Bought by
Charles G Gibson
Purchase Details
Closed on
Jan 1, 1967
Sold by
Clay W Rainwater
Bought by
Charles G Gibson
Create a Home Valuation Report for This Property
The Home Valuation Report is an in-depth analysis detailing your home's value as well as a comparison with similar homes in the area
Home Values in the Area
Average Home Value in this Area
Purchase History
| Date | Buyer | Sale Price | Title Company |
|---|---|---|---|
| Seay John D | $168,000 | -- | |
| Templeton Richard | $154,000 | -- | |
| Julie K Adams | $141,000 | -- | |
| Yates Unlimited Inc | $84,000 | -- | |
| Realtor Jane L | $90,000 | -- | |
| Walters Robert | $75,500 | -- | |
| Charles G Gibson | -- | -- | |
| Charles G Gibson | -- | -- |
Source: Public Records
Tax History Compared to Growth
Tax History
| Year | Tax Paid | Tax Assessment Tax Assessment Total Assessment is a certain percentage of the fair market value that is determined by local assessors to be the total taxable value of land and additions on the property. | Land | Improvement |
|---|---|---|---|---|
| 2024 | $2,461 | $92,220 | $18,000 | $74,220 |
| 2023 | $2,373 | $88,980 | $18,000 | $70,980 |
| 2022 | $2,284 | $83,820 | $18,000 | $65,820 |
| 2021 | $2,149 | $73,240 | $18,000 | $55,240 |
| 2020 | $2,149 | $73,240 | $18,000 | $55,240 |
| 2019 | $1,921 | $65,684 | $17,400 | $48,284 |
| 2018 | $1,852 | $63,400 | $17,400 | $46,000 |
| 2017 | $1,746 | $59,892 | $18,000 | $41,892 |
| 2016 | $1,775 | $60,821 | $18,000 | $42,821 |
| 2015 | $1,778 | $60,821 | $18,000 | $42,821 |
| 2014 | $1,422 | $48,959 | $17,416 | $31,544 |
| 2013 | -- | $51,463 | $17,488 | $33,975 |
Source: Public Records
Map
Nearby Homes
- 603 Country Club Rd
- 609 Cherokee Rd
- 705 Piney Woods Dr
- 748 Lakewood Dr
- 203 Waverly Way
- 109 Waverly Way
- 110 Waverly Way
- 105 Saynor Cir
- 408 Gordon St
- 145 Turner St
- 724 Camellia Dr
- 102 Ewing St
- 106 Ewing St
- 209 N Lee St
- 0 N Lee St Unit 10550825
- 203 S Chilton Crescent
- 201 S Chilton Crescent
- 217 Jefferson St
- 109 Thomas St
- 219 Banks St
- 715 Ridgecrest Rd
- 701 Ridgecrest Rd
- 239 Westwood Dr
- 706 Ridgecrest Rd
- 712 Ridgecrest Rd
- 717 Ridgecrest Rd
- 714 Ridgecrest Rd Unit 53
- 714 Ridgecrest Rd
- 235 Westwood Dr
- 718 Ridgecrest Rd
- 233 Westwood Dr
- 233 Westwood Dr Unit 20
- 246 Westwood Dr
- 607 Ridgecrest Rd
- 244 Westwood Dr
- 722 Ridgecrest Rd
- 242 Westwood Dr
- 225 Westwood Dr
- 700 Ridgecrest Rd
- 603 Ridgecrest Rd