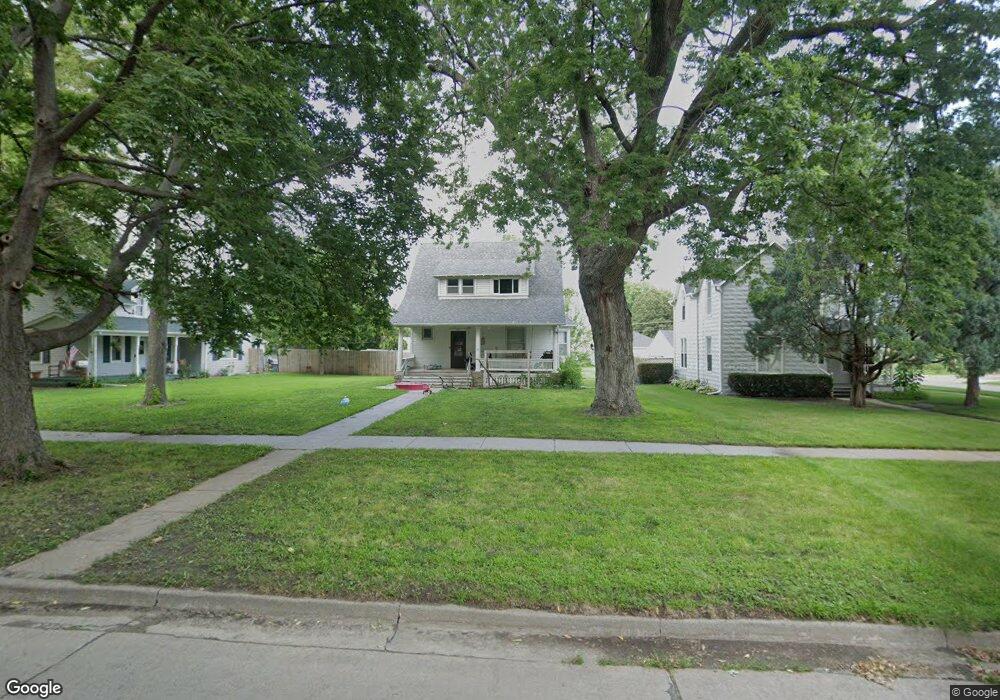
713 S 5th St Norfolk, NE 68701
Estimated Value: $176,049 - $195,000
1
Bed
1
Bath
1,447
Sq Ft
$127/Sq Ft
Est. Value
About This Home
This home is located at 713 S 5th St, Norfolk, NE 68701 and is currently estimated at $184,262, approximately $127 per square foot. 713 S 5th St is a home located in Madison County with nearby schools including Norfolk Senior High School, Christ Lutheran School, and Keystone Christian Academy.
Ownership History
Date
Name
Owned For
Owner Type
Purchase Details
Closed on
Oct 1, 2013
Sold by
Talcott Susan and Talcott Stanley M
Bought by
Mcclain Travis
Current Estimated Value
Home Financials for this Owner
Home Financials are based on the most recent Mortgage that was taken out on this home.
Original Mortgage
$63,250
Outstanding Balance
$47,601
Interest Rate
4.54%
Mortgage Type
Future Advance Clause Open End Mortgage
Estimated Equity
$136,661
Purchase Details
Closed on
Sep 30, 2013
Sold by
Brammer Heidi J and Brammer Scott
Bought by
Mcclain Travis
Home Financials for this Owner
Home Financials are based on the most recent Mortgage that was taken out on this home.
Original Mortgage
$63,250
Outstanding Balance
$47,601
Interest Rate
4.54%
Mortgage Type
Future Advance Clause Open End Mortgage
Estimated Equity
$136,661
Create a Home Valuation Report for This Property
The Home Valuation Report is an in-depth analysis detailing your home's value as well as a comparison with similar homes in the area
Home Values in the Area
Average Home Value in this Area
Purchase History
| Date | Buyer | Sale Price | Title Company |
|---|---|---|---|
| Mcclain Travis | $71,000 | American Title & Ecrow Co | |
| Mcclain Travis | -- | American Title And Escrow |
Source: Public Records
Mortgage History
| Date | Status | Borrower | Loan Amount |
|---|---|---|---|
| Open | Mcclain Travis | $63,250 | |
| Closed | Mcclain Travis | $7,500 |
Source: Public Records
Tax History Compared to Growth
Tax History
| Year | Tax Paid | Tax Assessment Tax Assessment Total Assessment is a certain percentage of the fair market value that is determined by local assessors to be the total taxable value of land and additions on the property. | Land | Improvement |
|---|---|---|---|---|
| 2024 | $1,654 | $132,665 | $14,138 | $118,527 |
| 2023 | $2,218 | $119,966 | $14,138 | $105,828 |
| 2022 | $2,013 | $108,627 | $14,138 | $94,489 |
| 2021 | $1,822 | $98,503 | $14,138 | $84,365 |
| 2020 | $1,650 | $89,464 | $14,138 | $75,326 |
| 2019 | $1,555 | $81,393 | $14,138 | $67,255 |
| 2018 | $1,341 | $71,359 | $11,310 | $60,049 |
| 2017 | $1,249 | $66,401 | $11,310 | $55,091 |
| 2016 | $1,117 | $59,286 | $10,098 | $49,188 |
| 2015 | $1,118 | $59,286 | $10,098 | $49,188 |
| 2014 | $1,151 | $59,286 | $10,098 | $49,188 |
| 2013 | $1,124 | $56,068 | $10,098 | $45,970 |
Source: Public Records
Map
Nearby Homes