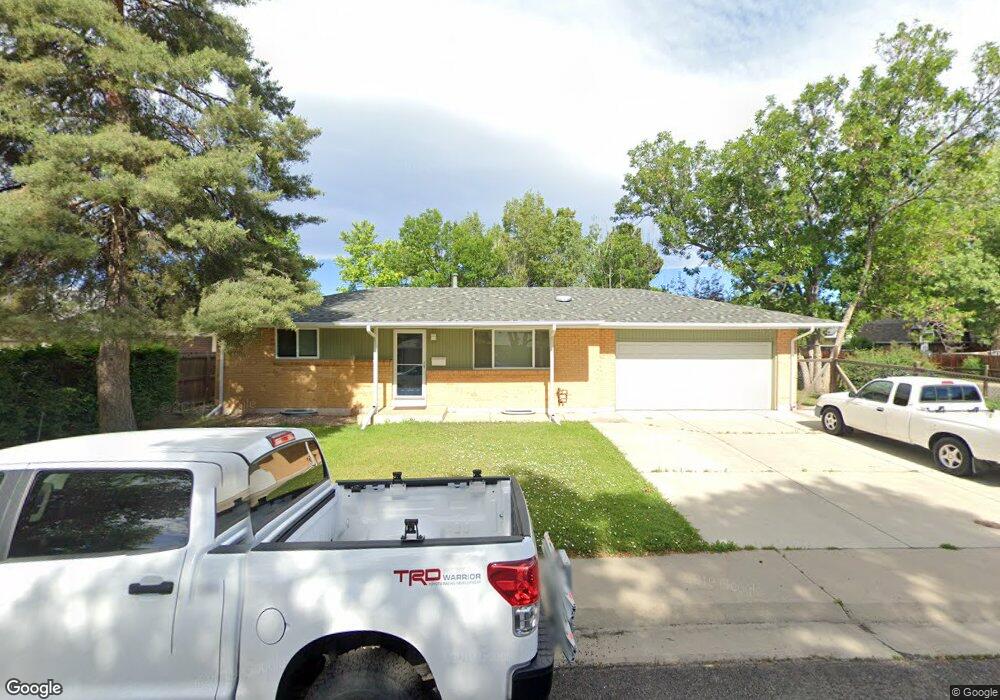
713 S Bermont Ave Lafayette, CO 80026
Estimated Value: $601,000 - $689,000
3
Beds
2
Baths
1,960
Sq Ft
$328/Sq Ft
Est. Value
About This Home
This home is located at 713 S Bermont Ave, Lafayette, CO 80026 and is currently estimated at $642,772, approximately $327 per square foot. 713 S Bermont Ave is a home located in Boulder County with nearby schools including Lafayette Elementary School, Angevine Middle School, and Centaurus High School.
Ownership History
Date
Name
Owned For
Owner Type
Purchase Details
Closed on
Nov 6, 2009
Sold by
Copeland Sidney E and Rouley Connie J
Bought by
Roth Theodore
Current Estimated Value
Home Financials for this Owner
Home Financials are based on the most recent Mortgage that was taken out on this home.
Original Mortgage
$257,631
Outstanding Balance
$168,481
Interest Rate
5.03%
Mortgage Type
FHA
Estimated Equity
$474,291
Purchase Details
Closed on
Jan 5, 1996
Sold by
Copeland Sidney E
Bought by
Copeland Sidney E
Purchase Details
Closed on
Oct 26, 1993
Sold by
Lehmann Michael E and Lehmann Linda A
Bought by
Copeland Sidney E
Home Financials for this Owner
Home Financials are based on the most recent Mortgage that was taken out on this home.
Original Mortgage
$101,950
Interest Rate
6.96%
Mortgage Type
FHA
Purchase Details
Closed on
Nov 9, 1988
Bought by
Theodore Roth and Stilwell Jennifer
Purchase Details
Closed on
Dec 10, 1984
Bought by
Theodore Roth and Stilwell Jennifer
Create a Home Valuation Report for This Property
The Home Valuation Report is an in-depth analysis detailing your home's value as well as a comparison with similar homes in the area
Home Values in the Area
Average Home Value in this Area
Purchase History
| Date | Buyer | Sale Price | Title Company |
|---|---|---|---|
| Roth Theodore | $262,400 | None Available | |
| Copeland Sidney E | -- | -- | |
| Copeland Sidney E | $115,500 | -- | |
| Theodore Roth | $79,200 | -- | |
| Theodore Roth | $81,000 | -- |
Source: Public Records
Mortgage History
| Date | Status | Borrower | Loan Amount |
|---|---|---|---|
| Open | Roth Theodore | $257,631 | |
| Previous Owner | Copeland Sidney E | $101,950 |
Source: Public Records
Tax History Compared to Growth
Tax History
| Year | Tax Paid | Tax Assessment Tax Assessment Total Assessment is a certain percentage of the fair market value that is determined by local assessors to be the total taxable value of land and additions on the property. | Land | Improvement |
|---|---|---|---|---|
| 2025 | $3,576 | $39,744 | $13,275 | $26,469 |
| 2024 | $3,576 | $39,744 | $13,275 | $26,469 |
| 2023 | $3,515 | $40,354 | $17,005 | $27,035 |
| 2022 | $3,070 | $32,686 | $11,968 | $20,718 |
| 2021 | $3,037 | $33,626 | $12,312 | $21,314 |
| 2020 | $2,858 | $31,267 | $10,511 | $20,756 |
| 2019 | $2,818 | $31,267 | $10,511 | $20,756 |
| 2018 | $2,487 | $27,238 | $9,000 | $18,238 |
| 2017 | $2,421 | $30,113 | $9,950 | $20,163 |
| 2016 | $2,113 | $23,013 | $8,199 | $14,814 |
| 2015 | $1,980 | $18,746 | $6,129 | $12,617 |
| 2014 | $1,621 | $18,746 | $6,129 | $12,617 |
Source: Public Records
Map
Nearby Homes
- 655 N Gooseberry Ct
- 924 Milo Cir Unit A
- 998 Milo Cir Unit A
- 511 S Roosevelt Ave
- 1068 Milo Cir Unit A
- 1091 Milo Cir Unit B
- 490 E Sutton Cir
- 403 W Cannon St
- 911 Homer Cir
- 372 S Carr Ave
- 1045 Milo Cir Unit A
- 1198 Milo Cir Unit A
- 1191 Milo Cir Unit A
- 304 Skylark Cir
- 200 S Carr Ave
- 285 Skylark Cir
- 880 Orion Dr
- 715 Bunting Dr
- 712 Bunting Dr
- 201 E Cleveland St
- 743 S Bermont Ave
- 714 S Bermont Dr
- 744 S Bermont Dr
- 693 S Bermont Ave
- 712 S Bermont Ave
- 773 S Bermont Ave
- 742 S Bermont Ave
- 694 S Bermont Dr
- 774 S Bermont Dr
- 0 S Bermont Dr
- 692 S Bermont Ave
- 772 S Bermont Ave
- 793 S Bermont Ave
- 673 S Bermont Ave
- 604 Kimbark St
- 794 S Bermont Dr
- 674 S Bermont Dr
- 745 S Bermont Dr
- 701 S Miller Ave
- 703 S Miller Ave