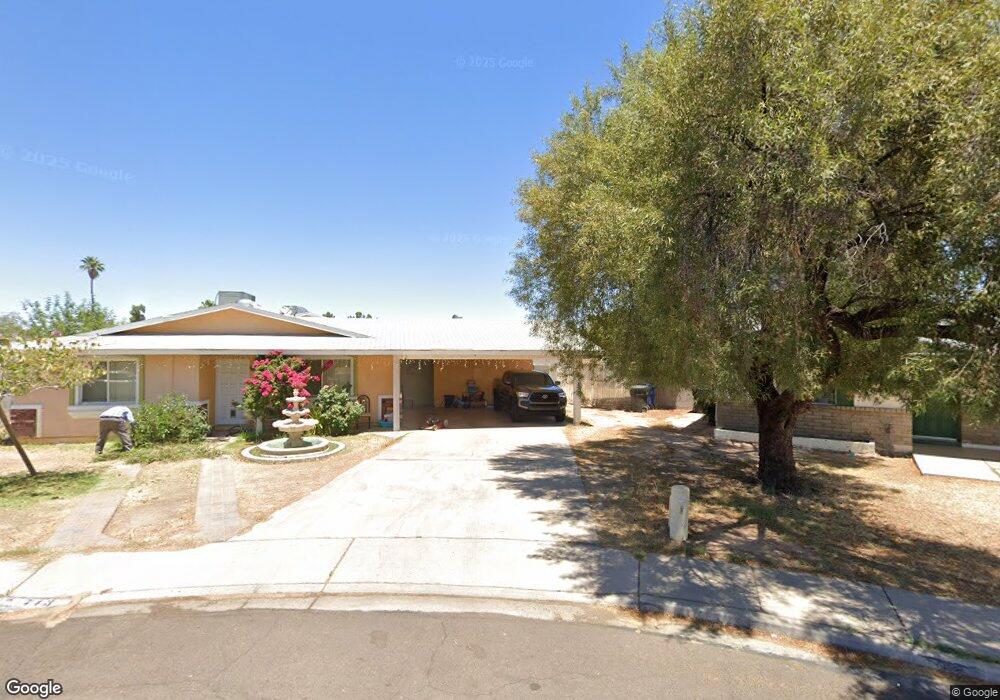
713 S Daley Mesa, AZ 85204
Reed Park NeighborhoodEstimated Value: $410,000 - $672,000
4
Beds
2
Baths
1,445
Sq Ft
$397/Sq Ft
Est. Value
About This Home
This home is located at 713 S Daley, Mesa, AZ 85204 and is currently estimated at $573,661, approximately $396 per square foot. 713 S Daley is a home located in Maricopa County with nearby schools including Lindbergh Elementary School, Franklin at Brimhall Elementary School, and Franklin West Elementary School.
Ownership History
Date
Name
Owned For
Owner Type
Purchase Details
Closed on
Oct 27, 2005
Sold by
Ammons George
Bought by
Ammoms Veronica
Current Estimated Value
Purchase Details
Closed on
Feb 11, 2004
Sold by
Paddila Leobardo and Ammons Veronica
Bought by
Padilla Leobardo
Purchase Details
Closed on
Nov 26, 2001
Sold by
Ammons George
Bought by
Ammons Veronica
Purchase Details
Closed on
Mar 27, 2001
Sold by
Chapman Lorenzo M
Bought by
Chapman Liane M
Home Financials for this Owner
Home Financials are based on the most recent Mortgage that was taken out on this home.
Original Mortgage
$110,250
Interest Rate
7.06%
Purchase Details
Closed on
Dec 16, 1998
Sold by
Chapman Liane M and Chapman Lorenzo M
Bought by
Chapman Lorenzo M and Chapman Liane
Purchase Details
Closed on
Jul 7, 1997
Sold by
Comer Benjamin M and Comer Sue
Bought by
Stannebein Liane and Chapman Lorenzo M
Home Financials for this Owner
Home Financials are based on the most recent Mortgage that was taken out on this home.
Original Mortgage
$84,356
Interest Rate
7.93%
Mortgage Type
FHA
Create a Home Valuation Report for This Property
The Home Valuation Report is an in-depth analysis detailing your home's value as well as a comparison with similar homes in the area
Home Values in the Area
Average Home Value in this Area
Purchase History
| Date | Buyer | Sale Price | Title Company |
|---|---|---|---|
| Ammoms Veronica | -- | -- | |
| Padilla Leobardo | -- | -- | |
| Padilla Leobardo | -- | -- | |
| Ammons Veronica | -- | North American Title Co | |
| Padilla Leobardo | $131,000 | North American Title Co | |
| Chapman Liane M | -- | Arizona Title Agency Inc | |
| Chapman Lorenzo M | -- | Arizona Title Agency Inc | |
| Stannebein Liane | $103,000 | Transnation Title Ins Co |
Source: Public Records
Mortgage History
| Date | Status | Borrower | Loan Amount |
|---|---|---|---|
| Previous Owner | Chapman Liane M | $110,250 | |
| Previous Owner | Stannebein Liane | $84,356 |
Source: Public Records
Tax History Compared to Growth
Tax History
| Year | Tax Paid | Tax Assessment Tax Assessment Total Assessment is a certain percentage of the fair market value that is determined by local assessors to be the total taxable value of land and additions on the property. | Land | Improvement |
|---|---|---|---|---|
| 2025 | $2,225 | $26,792 | -- | -- |
| 2024 | $2,249 | $25,516 | -- | -- |
| 2023 | $2,249 | $50,560 | $10,110 | $40,450 |
| 2022 | $2,200 | $36,710 | $7,340 | $29,370 |
| 2021 | $2,260 | $36,430 | $7,280 | $29,150 |
| 2020 | $2,230 | $30,180 | $6,030 | $24,150 |
| 2019 | $2,066 | $28,500 | $5,700 | $22,800 |
| 2018 | $1,972 | $26,920 | $5,380 | $21,540 |
| 2017 | $1,910 | $23,860 | $4,770 | $19,090 |
| 2016 | $1,880 | $23,080 | $4,610 | $18,470 |
| 2015 | $841 | $11,880 | $2,370 | $9,510 |
Source: Public Records
Map
Nearby Homes
- 1521 E Diamond Ave
- 749 S Lazona Dr
- 1424 E El Moro Ave
- 943 S Lazona Dr
- 1750 E Mateo Cir Unit 103
- 908 S Kachina
- 1953 E Marilyn Ave
- 1340 E Crescent Ave
- 1432 E Broadway Rd
- 1324 E Forge Ave
- 1137 E 5th Ave
- 1064 E Dolphin Ave
- 1752 E Gable Ave
- 1030 S Stapley Dr Unit TR-B
- 1048 E 6th Ave
- 2226 E Diamond Ave
- 211 S Doran
- 1714 E Dana Ave
- 2154 E Forge Ave
- 1402 E Dana Ave