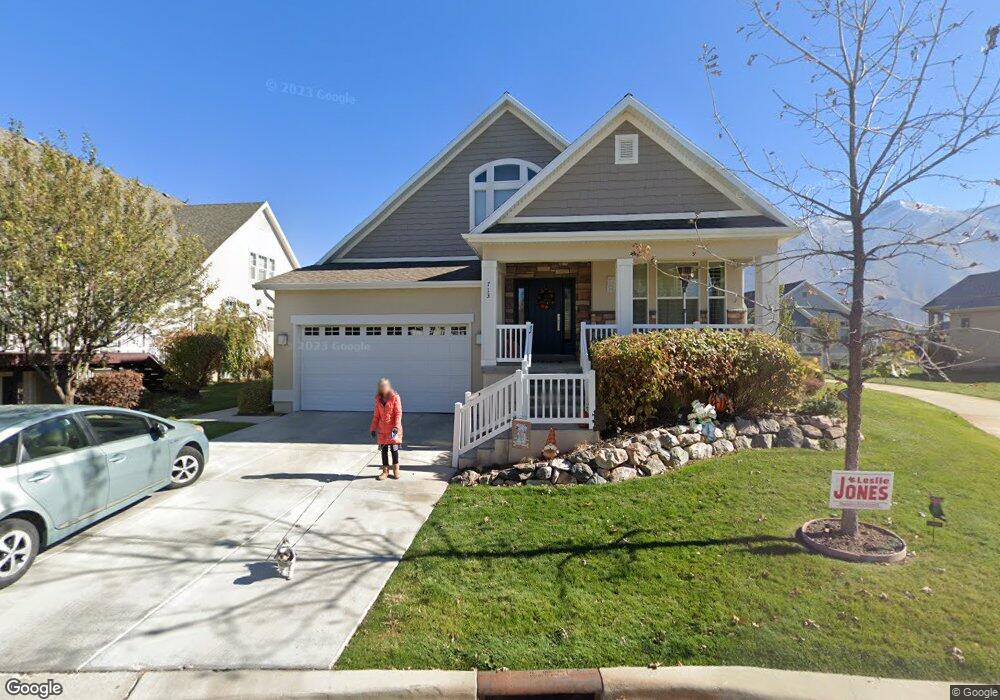
713 S Willow Ln Mapleton, UT 84664
Estimated Value: $669,461 - $703,000
5
Beds
3
Baths
3,878
Sq Ft
$176/Sq Ft
Est. Value
About This Home
This home is located at 713 S Willow Ln, Mapleton, UT 84664 and is currently estimated at $681,487, approximately $175 per square foot. 713 S Willow Ln is a home located in Utah County with nearby schools including Maple Ridge Elementary, Mapleton Junior High School, and Maple Mountain High School.
Ownership History
Date
Name
Owned For
Owner Type
Purchase Details
Closed on
Aug 29, 2023
Sold by
Welsh Ricky and Welsh Mary Pamela
Bought by
Welsh Living Trust and Welsh
Current Estimated Value
Purchase Details
Closed on
Mar 16, 2015
Sold by
Ckap Properties Llc
Bought by
Kawai Kerry
Home Financials for this Owner
Home Financials are based on the most recent Mortgage that was taken out on this home.
Original Mortgage
$335,920
Interest Rate
3.54%
Mortgage Type
New Conventional
Purchase Details
Closed on
Jun 8, 2013
Sold by
Ren Enterprises Llc
Bought by
Krueger Cade
Purchase Details
Closed on
Jun 7, 2013
Sold by
Krueger Cade
Bought by
Ckap Properties Llc
Purchase Details
Closed on
Dec 16, 2009
Sold by
Sourceone Financial Inc
Bought by
Ren Enterprises Llc
Purchase Details
Closed on
Mar 10, 2009
Sold by
Harvest Park Homes Llc
Bought by
Sourceone Financial Inc
Create a Home Valuation Report for This Property
The Home Valuation Report is an in-depth analysis detailing your home's value as well as a comparison with similar homes in the area
Home Values in the Area
Average Home Value in this Area
Purchase History
| Date | Buyer | Sale Price | Title Company |
|---|---|---|---|
| Welsh Living Trust | -- | None Listed On Document | |
| Kawai Kerry | -- | Provo Abstract Co | |
| Krueger Cade | -- | Pro Title And Escrow Inc | |
| Ckap Properties Llc | -- | Provo Land Title Co | |
| Krueger Cade | -- | Provo Land Title Co | |
| Ren Enterprises Llc | -- | Meridian Title Company | |
| Sourceone Financial Inc | -- | None Available |
Source: Public Records
Mortgage History
| Date | Status | Borrower | Loan Amount |
|---|---|---|---|
| Previous Owner | Kawai Kerry | $335,920 |
Source: Public Records
Tax History
| Year | Tax Paid | Tax Assessment Tax Assessment Total Assessment is a certain percentage of the fair market value that is determined by local assessors to be the total taxable value of land and additions on the property. | Land | Improvement |
|---|---|---|---|---|
| 2025 | $3,082 | $332,695 | -- | -- |
| 2024 | $3,082 | $301,895 | $0 | $0 |
| 2023 | $3,194 | $314,875 | $0 | $0 |
| 2022 | $3,643 | $355,080 | $0 | $0 |
| 2021 | $3,147 | $471,000 | $111,000 | $360,000 |
| 2020 | $3,111 | $450,400 | $100,900 | $349,500 |
| 2019 | $2,751 | $406,500 | $92,000 | $314,500 |
| 2018 | $2,666 | $375,000 | $85,200 | $289,800 |
| 2017 | $2,434 | $181,720 | $0 | $0 |
| 2016 | $2,345 | $174,020 | $0 | $0 |
| 2015 | $1,447 | $106,755 | $0 | $0 |
| 2014 | $846 | $61,300 | $0 | $0 |
Source: Public Records
Map
Nearby Homes
- 715 W 4600 S Unit Lot I303
- 715 W 4600 S Unit Lot I304
- 889 Sego Lily Way
- 1810 W 300 S Unit D
- 1656 W 300 S Unit B
- 906 S Crescent Way
- 1655 W 200 S Unit A
- 2216 W Silver Leaf Dr Unit 35
- 1352 W 900 S
- 161 W 250 S
- 473 W 350 S Unit 31
- 1780 W Maple St
- 2652 W Maple St Unit 281
- 415 S 1200 W
- 442 S Doubleday St
- 1058 S Lilac Way
- 203 N 1900 W
- 216 N 1750 W
- 896 W 675 S
- 572 S Chamberlain St
- 713 S Willow Ln
- 713 S Willow Ln Unit V-5
- 683 S Willow Ln
- 683 S Willow Ln Unit V-6
- 683 S Willow Ln Unit V6
- 1803 W Elm St
- 1803 W Elm St Unit V-7
- 1803 W Elm St Unit V7
- 684 S Willow Ln Unit U-8
- 684 S Willow Ln
- 737 S Willow Ln
- 706 S Willow Ln Unit U-9
- 706 S Willow Ln
- 734 S Willow Ln Unit U-10
- 734 S Willow Ln
- 728 S Golden Leaf Way
- 736 Willow Ln
- 759 S Willow Ln
- 1871 W Elm St
- 1871 W Elm St Unit U-7
Your Personal Tour Guide
Ask me questions while you tour the home.