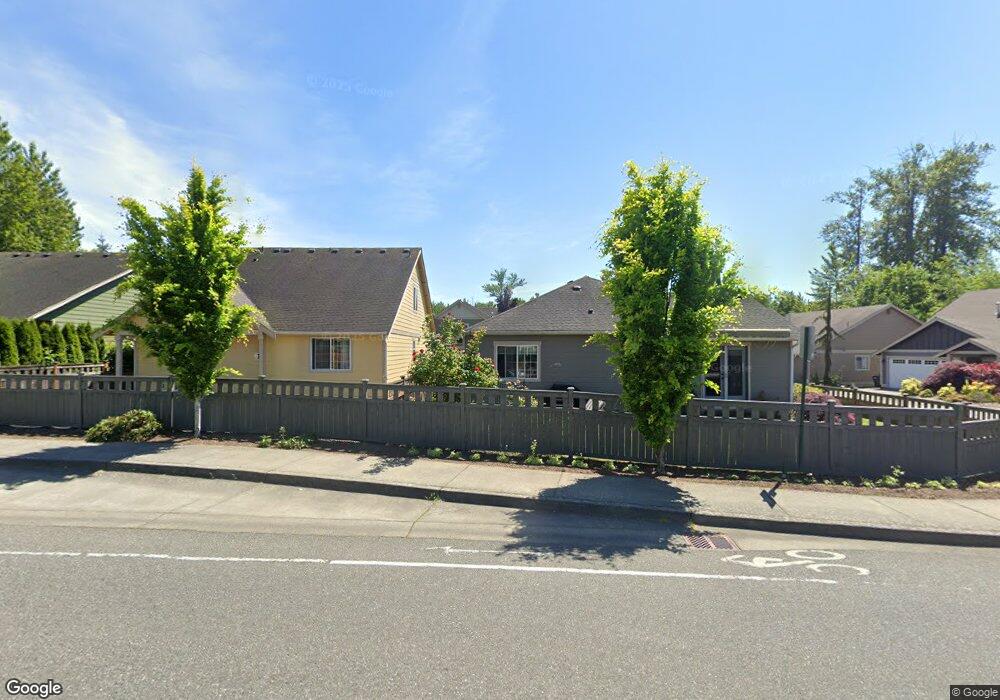
713 Verbena Ln Unit Lot 5 Bellingham, WA 98226
Cordata NeighborhoodEstimated Value: $582,000 - $634,000
3
Beds
3
Baths
1,473
Sq Ft
$418/Sq Ft
Est. Value
About This Home
This home is located at 713 Verbena Ln Unit Lot 5, Bellingham, WA 98226 and is currently estimated at $616,423, approximately $418 per square foot. 713 Verbena Ln Unit Lot 5 is a home located in Whatcom County with nearby schools including Cordata Elementary School, Shuksan Middle School, and Squalicum High School.
Ownership History
Date
Name
Owned For
Owner Type
Purchase Details
Closed on
Sep 13, 2018
Sold by
Willis Ford Geoffrey and Willis Eerin
Bought by
Minhas Jasmit
Current Estimated Value
Home Financials for this Owner
Home Financials are based on the most recent Mortgage that was taken out on this home.
Original Mortgage
$356,250
Outstanding Balance
$310,031
Interest Rate
4.5%
Mortgage Type
New Conventional
Estimated Equity
$306,392
Purchase Details
Closed on
May 14, 2015
Sold by
Cordata Green Llc
Bought by
Willis Ford Geoffrey and Willis Erin
Home Financials for this Owner
Home Financials are based on the most recent Mortgage that was taken out on this home.
Original Mortgage
$261,504
Interest Rate
3.67%
Mortgage Type
VA
Purchase Details
Closed on
Oct 7, 2013
Sold by
Aldrich Park Llc
Bought by
Cordata Green Llc
Create a Home Valuation Report for This Property
The Home Valuation Report is an in-depth analysis detailing your home's value as well as a comparison with similar homes in the area
Home Values in the Area
Average Home Value in this Area
Purchase History
| Date | Buyer | Sale Price | Title Company |
|---|---|---|---|
| Minhas Jasmit | $375,000 | Chicago Title Ins | |
| Willis Ford Geoffrey | $256,000 | Whatcom Land Title | |
| Cordata Green Llc | -- | Accommodation |
Source: Public Records
Mortgage History
| Date | Status | Borrower | Loan Amount |
|---|---|---|---|
| Open | Minhas Jasmit | $356,250 | |
| Previous Owner | Willis Ford Geoffrey | $261,504 |
Source: Public Records
Tax History Compared to Growth
Tax History
| Year | Tax Paid | Tax Assessment Tax Assessment Total Assessment is a certain percentage of the fair market value that is determined by local assessors to be the total taxable value of land and additions on the property. | Land | Improvement |
|---|---|---|---|---|
| 2024 | $4,161 | $534,582 | $109,224 | $425,358 |
| 2023 | $4,161 | $534,582 | $109,224 | $425,358 |
| 2022 | $3,637 | $481,605 | $98,400 | $383,205 |
| 2021 | $3,527 | $391,549 | $80,000 | $311,549 |
| 2020 | $3,363 | $358,356 | $100,644 | $257,712 |
| 2019 | $2,942 | $330,284 | $92,760 | $237,524 |
| 2018 | $2,961 | $289,693 | $81,360 | $208,333 |
| 2017 | $2,591 | $249,316 | $70,020 | $179,296 |
| 2016 | $2,332 | $227,952 | $64,020 | $163,932 |
| 2015 | -- | $213,638 | $60,000 | $153,638 |
| 2014 | -- | $215,790 | $63,420 | $152,370 |
| 2013 | -- | $200,478 | $58,920 | $141,558 |
Source: Public Records
Map
Nearby Homes
- 4314 Gale Ln
- 4305 Sumac Ln
- 1150 E Village Ln Unit A
- 4121 Village Dr Unit 9
- 5090 Festival Blvd Unit 1C
- 508 Darby Dr Unit 315
- 516 Darby Dr Unit 207
- 516 Darby Dr Unit 213
- 516 Darby Dr Unit 104
- 504 Darby Dr Unit 110
- 512 Darby Dr Unit 213
- 512 Darby Dr Unit 111
- 512 Darby Dr Unit 212
- 5070 Festival Blvd Unit 2B
- 4252 Northwest Dr
- 5064 Festival Blvd Unit 2B
- 617 Sunflower Ln Unit E2
- 500 Darby Dr Unit 304
- 500 Darby Dr Unit 210
- 500 Darby Dr Unit 314
- 713 Verbena Ln
- 709 Verbena
- 709 Verbena Lot#6
- 752 Fuchsia Lp Unit 32
- 705 Verbena Ln
- 4247 Fuschia Dr Unit 4
- 4247 Fuchsia Dr
- 4247 Fuchsia Dr Unit 4
- 748 Fuchsia Loop Unit 31
- 710 Verbena Ln Unit Lot11
- 714 Verbena Ln Unit lot12
- 701 Verbena Ln
- 4249 Fuchsia Dr Unit lot3
- 702 Verbena Ln Unit Lot 9
- 702 Verbena Ln Unit 9
- 706 Verbena Ln Unit lot10
- 4245 Fuchsia Dr Unit 13
- 749 Fuchsia Lp Unit 34
- 746 Fuchsia Lp Unit 30
- 4251 Fuchsia Dr