Estimated Value: $141,000 - $163,000
2
Beds
1
Bath
940
Sq Ft
$162/Sq Ft
Est. Value
About This Home
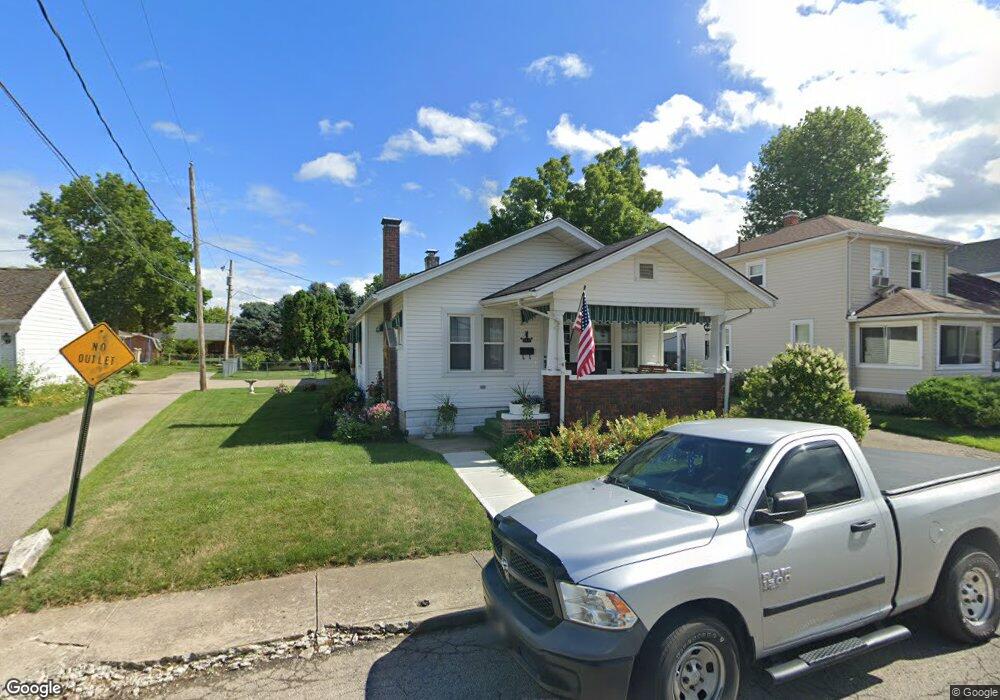
This home is located at 713 Vine St, Piqua, OH 45356 and is currently estimated at $152,608, approximately $162 per square foot. 713 Vine St is a home located in Miami County with nearby schools including Piqua Central Intermediate School, Springcreek Primary School, and Piqua Junior High School.
Ownership History
Date
Name
Owned For
Owner Type
Purchase Details
Closed on
Jun 19, 2001
Sold by
Herron Goldie M
Bought by
Burnside Christopher M and Burnside Tammy S
Current Estimated Value
Purchase Details
Closed on
Jul 24, 1995
Sold by
Wolfe Jerry A
Bought by
Christopher M Burnside
Create a Home Valuation Report for This Property
The Home Valuation Report is an in-depth analysis detailing your home's value as well as a comparison with similar homes in the area
Home Values in the Area
Average Home Value in this Area
Purchase History
| Date | Buyer | Sale Price | Title Company |
|---|---|---|---|
| Burnside Christopher M | -- | -- | |
| Christopher M Burnside | $65,000 | -- |
Source: Public Records
Tax History
| Year | Tax Paid | Tax Assessment Tax Assessment Total Assessment is a certain percentage of the fair market value that is determined by local assessors to be the total taxable value of land and additions on the property. | Land | Improvement |
|---|---|---|---|---|
| 2025 | $1,584 | $44,880 | $9,280 | $35,600 |
| 2024 | $1,584 | $35,740 | $10,010 | $25,730 |
| 2023 | $1,469 | $35,740 | $10,010 | $25,730 |
| 2022 | $1,494 | $35,740 | $10,010 | $25,730 |
| 2021 | $1,256 | $27,480 | $7,700 | $19,780 |
| 2020 | $1,231 | $27,480 | $7,700 | $19,780 |
| 2019 | $1,238 | $27,480 | $7,700 | $19,780 |
| 2018 | $1,098 | $23,280 | $8,020 | $15,260 |
| 2017 | $1,112 | $23,280 | $8,020 | $15,260 |
| 2016 | $1,099 | $23,280 | $8,020 | $15,260 |
| 2015 | $1,081 | $22,370 | $7,700 | $14,670 |
| 2014 | $1,081 | $22,370 | $7,700 | $14,670 |
| 2013 | $1,085 | $22,370 | $7,700 | $14,670 |
Source: Public Records
Map
Nearby Homes
- 723 Vine St
- 1514 Nicklin Ave
- 1307 Walker St
- 1507 Nicklin Ave
- 614 Cherry St
- 618 Cherry St
- 1414 Washington Ave
- 1115 Madison Ave
- 505 Scott St
- 908 Camp St
- 1040 Camp St
- 454 Riverside Dr
- 1102 Fountain Blvd
- 419 Riverside Dr
- 802 Washington Ave
- 735 Park Ave
- 931 Caldwell St
- 1062 Boone St
- 630 Boone St
- 651 Boone St
Your Personal Tour Guide
Ask me questions while you tour the home.