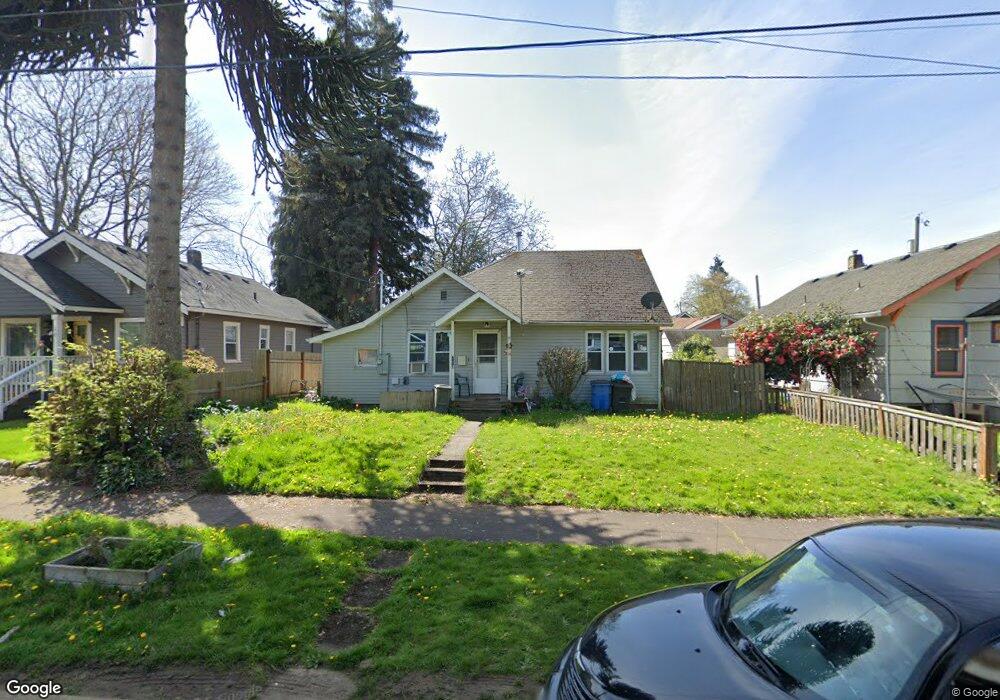
713 W 21st St Vancouver, WA 98660
Hough NeighborhoodEstimated Value: $419,000 - $567,000
3
Beds
1
Bath
1,022
Sq Ft
$488/Sq Ft
Est. Value
About This Home
This home is located at 713 W 21st St, Vancouver, WA 98660 and is currently estimated at $498,865, approximately $488 per square foot. 713 W 21st St is a home located in Clark County with nearby schools including Hough Elementary School, Discovery Middle School, and Hudson's Bay High School.
Ownership History
Date
Name
Owned For
Owner Type
Purchase Details
Closed on
Jun 10, 2008
Sold by
Hoffman Barton
Bought by
Hoffman Barton and Usher Karen I
Current Estimated Value
Home Financials for this Owner
Home Financials are based on the most recent Mortgage that was taken out on this home.
Original Mortgage
$188,993
Outstanding Balance
$121,276
Interest Rate
6.05%
Mortgage Type
FHA
Estimated Equity
$377,589
Purchase Details
Closed on
Mar 16, 2004
Sold by
Dunkin Joseph P
Bought by
Hoffman Barton
Home Financials for this Owner
Home Financials are based on the most recent Mortgage that was taken out on this home.
Original Mortgage
$98,400
Interest Rate
6.7%
Mortgage Type
Purchase Money Mortgage
Purchase Details
Closed on
Jun 27, 2003
Sold by
Vanhorne Beth C
Bought by
Dunkin Joseph P
Purchase Details
Closed on
Jan 27, 1998
Sold by
Miller Walter C
Bought by
Vanhorne Beth C
Home Financials for this Owner
Home Financials are based on the most recent Mortgage that was taken out on this home.
Original Mortgage
$90,000
Interest Rate
7.05%
Mortgage Type
VA
Create a Home Valuation Report for This Property
The Home Valuation Report is an in-depth analysis detailing your home's value as well as a comparison with similar homes in the area
Home Values in the Area
Average Home Value in this Area
Purchase History
| Date | Buyer | Sale Price | Title Company |
|---|---|---|---|
| Hoffman Barton | $94,496 | Cascade Title | |
| Hoffman Barton | $123,000 | Chicago Title Insurance | |
| Dunkin Joseph P | $64,000 | Cascade Title | |
| Vanhorne Beth C | $90,000 | First American Title Ins Co |
Source: Public Records
Mortgage History
| Date | Status | Borrower | Loan Amount |
|---|---|---|---|
| Open | Hoffman Barton | $188,993 | |
| Previous Owner | Hoffman Barton | $98,400 | |
| Previous Owner | Vanhorne Beth C | $90,000 | |
| Closed | Hoffman Barton | $24,600 |
Source: Public Records
Tax History Compared to Growth
Tax History
| Year | Tax Paid | Tax Assessment Tax Assessment Total Assessment is a certain percentage of the fair market value that is determined by local assessors to be the total taxable value of land and additions on the property. | Land | Improvement |
|---|---|---|---|---|
| 2025 | $4,293 | $420,499 | $223,528 | $196,971 |
| 2024 | $3,986 | $439,496 | $223,528 | $215,968 |
| 2023 | $3,864 | $425,995 | $214,441 | $211,554 |
| 2022 | $3,422 | $414,640 | $221,711 | $192,929 |
| 2021 | $3,353 | $342,066 | $181,730 | $160,336 |
| 2020 | $2,945 | $315,932 | $155,715 | $160,217 |
| 2019 | $2,588 | $287,478 | $139,672 | $147,806 |
| 2018 | $2,772 | $261,658 | $0 | $0 |
| 2017 | $2,433 | $232,712 | $0 | $0 |
| 2016 | $2,242 | $213,124 | $0 | $0 |
| 2015 | $2,175 | $187,671 | $0 | $0 |
| 2014 | -- | $172,102 | $0 | $0 |
| 2013 | -- | $163,937 | $0 | $0 |
Source: Public Records
Map
Nearby Homes
- 2000 Harney St
- 2117 Kauffman Ave
- 1908 Grant St
- 2100 Kauffman Ave
- 806 W Mcloughlin Blvd
- 709 W Fourth Plain Blvd
- 401 W 23rd St
- 2413 Markle Ave
- 610 W Fourth Plain Blvd
- 610 W Fourth Plain Blvd Unit A
- 600 W 27th St
- 127 W 24th St
- 1902 Washington St
- 112 W 21st St
- 501 W 30th St
- 1911 Broadway St
- 1911 Broadway St Unit 1
- 1911 Broadway St Unit 6
- 3001 Daniels St
- 316 W 30th St