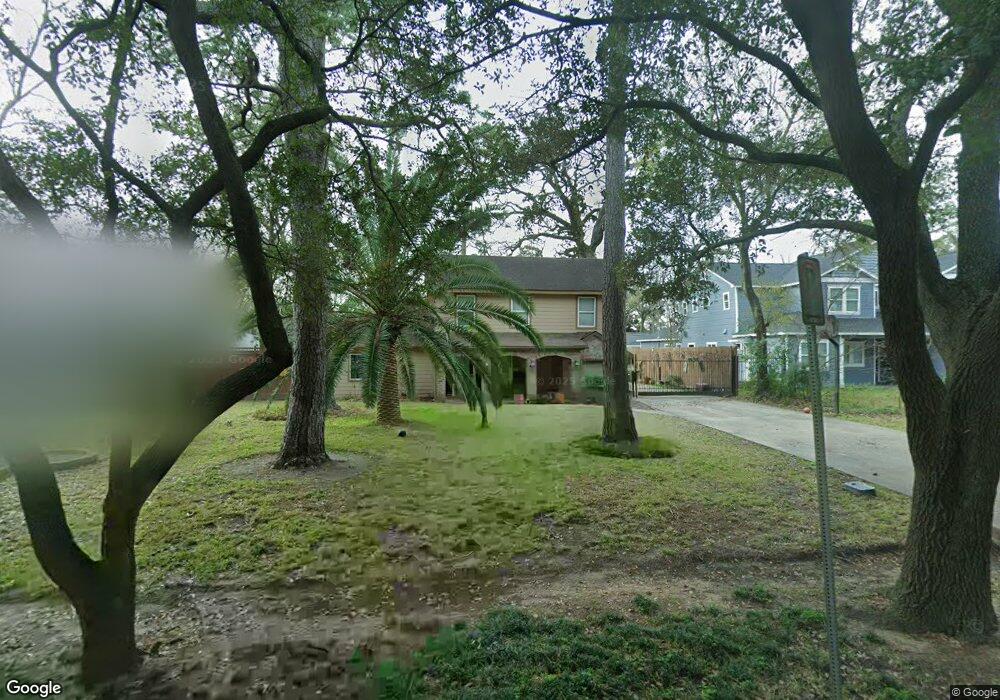
713 W 39th St Houston, TX 77018
Oak Forest-Garden Oaks NeighborhoodEstimated Value: $769,000 - $867,000
2
Beds
2
Baths
2,298
Sq Ft
$363/Sq Ft
Est. Value
About This Home
This home is located at 713 W 39th St, Houston, TX 77018 and is currently estimated at $834,760, approximately $363 per square foot. 713 W 39th St is a home located in Harris County with nearby schools including Garden Oaks Montessori, Frank Black Middle School, and Waltrip High School.
Ownership History
Date
Name
Owned For
Owner Type
Purchase Details
Closed on
Nov 26, 2001
Sold by
Curtis Max M and Curtis Irma Jean
Bought by
Curtis Bryce and Curtis Yadira
Current Estimated Value
Home Financials for this Owner
Home Financials are based on the most recent Mortgage that was taken out on this home.
Original Mortgage
$111,150
Interest Rate
6.57%
Create a Home Valuation Report for This Property
The Home Valuation Report is an in-depth analysis detailing your home's value as well as a comparison with similar homes in the area
Home Values in the Area
Average Home Value in this Area
Purchase History
| Date | Buyer | Sale Price | Title Company |
|---|---|---|---|
| Curtis Bryce | -- | American Title Co |
Source: Public Records
Mortgage History
| Date | Status | Borrower | Loan Amount |
|---|---|---|---|
| Closed | Curtis Bryce | $111,150 |
Source: Public Records
Tax History Compared to Growth
Tax History
| Year | Tax Paid | Tax Assessment Tax Assessment Total Assessment is a certain percentage of the fair market value that is determined by local assessors to be the total taxable value of land and additions on the property. | Land | Improvement |
|---|---|---|---|---|
| 2025 | $10,686 | $700,250 | $563,850 | $136,400 |
| 2024 | $10,686 | $689,087 | $563,850 | $125,237 |
| 2023 | $10,686 | $701,887 | $537,000 | $164,887 |
| 2022 | $13,927 | $651,099 | $443,025 | $208,074 |
| 2021 | $13,401 | $575,000 | $416,175 | $158,825 |
| 2020 | $13,355 | $551,519 | $416,175 | $135,344 |
| 2019 | $13,348 | $527,500 | $416,175 | $111,325 |
| 2018 | $10,612 | $550,960 | $375,900 | $175,060 |
| 2017 | $12,332 | $487,698 | $335,625 | $152,073 |
| 2016 | $12,557 | $510,895 | $335,625 | $175,270 |
| 2015 | $8,304 | $469,500 | $335,625 | $133,875 |
| 2014 | $8,304 | $437,068 | $335,625 | $101,443 |
Source: Public Records
Map
Nearby Homes
- 709 W 39th St
- 710 Sue Barnett Dr
- 717 Sue Barnett Dr
- 765 Sue Barnett Dr
- 806 Fisher St Unit C
- 806 Fisher St Unit B
- 806 Fisher St Unit F
- 3809 Brinkman St
- 814 W 41st St
- 824 Wakefield Dr Unit A
- 820 Wakefield Dr Unit A
- 831 Wakefield Dr Unit A
- 524 W 34th St
- 811 Sara Rose St
- 833 Fisher St Unit C
- 834 W 41st St
- 3909 Zina Way
- 822 W 31st St
- 3902 Zina Way
- 3908 Zina Way