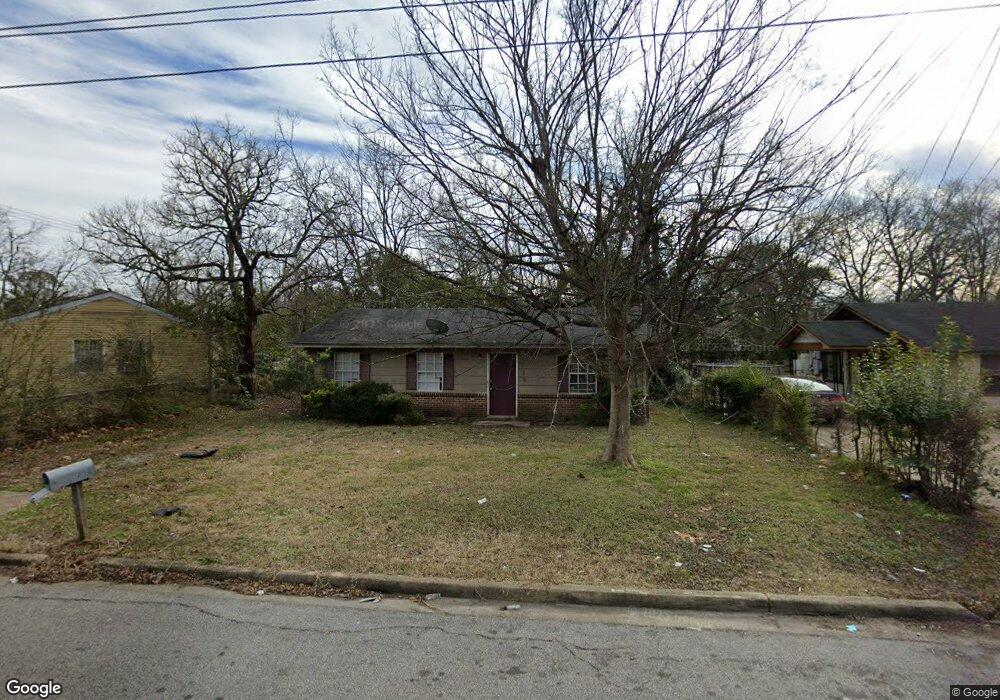
713 W April St Montgomery, AL 36105
Estimated Value: $40,000 - $70,000
3
Beds
2
Baths
988
Sq Ft
$58/Sq Ft
Est. Value
About This Home
This home is located at 713 W April St, Montgomery, AL 36105 and is currently estimated at $57,256, approximately $57 per square foot. 713 W April St is a home located in Montgomery County with nearby schools including Bellingrath Junior High School, Lanier Senior High School, and Davis Elementary School.
Ownership History
Date
Name
Owned For
Owner Type
Purchase Details
Closed on
Dec 21, 2009
Sold by
Quadrant Residential Capital 1 Llc
Bought by
Star Properties Llc
Current Estimated Value
Purchase Details
Closed on
Aug 13, 2009
Sold by
Whitting Lanette
Bought by
Quadrant Residential Capital 1 Llc
Purchase Details
Closed on
Jun 6, 2005
Sold by
Lewis Alexander
Bought by
Whitting Lanette
Home Financials for this Owner
Home Financials are based on the most recent Mortgage that was taken out on this home.
Original Mortgage
$50,000
Interest Rate
7.9%
Mortgage Type
Fannie Mae Freddie Mac
Purchase Details
Closed on
Oct 22, 2004
Sold by
Hud
Bought by
Lewis Alexander
Home Financials for this Owner
Home Financials are based on the most recent Mortgage that was taken out on this home.
Original Mortgage
$23,000
Interest Rate
5.77%
Mortgage Type
Purchase Money Mortgage
Purchase Details
Closed on
Oct 28, 2003
Sold by
Thompson Rosie Lee
Bought by
Ge Mortgage Services Llc
Create a Home Valuation Report for This Property
The Home Valuation Report is an in-depth analysis detailing your home's value as well as a comparison with similar homes in the area
Home Values in the Area
Average Home Value in this Area
Purchase History
| Date | Buyer | Sale Price | Title Company |
|---|---|---|---|
| Star Properties Llc | $10,000 | None Available | |
| Quadrant Residential Capital 1 Llc | $10,500 | None Available | |
| Whitting Lanette | -- | -- | |
| Lewis Alexander | $23,000 | -- | |
| Ge Mortgage Services Llc | $33,287 | -- |
Source: Public Records
Mortgage History
| Date | Status | Borrower | Loan Amount |
|---|---|---|---|
| Previous Owner | Whitting Lanette | $50,000 | |
| Previous Owner | Lewis Alexander | $23,000 |
Source: Public Records
Tax History Compared to Growth
Tax History
| Year | Tax Paid | Tax Assessment Tax Assessment Total Assessment is a certain percentage of the fair market value that is determined by local assessors to be the total taxable value of land and additions on the property. | Land | Improvement |
|---|---|---|---|---|
| 2025 | $293 | $6,340 | $500 | $5,840 |
| 2024 | $275 | $5,560 | $500 | $5,060 |
| 2023 | $275 | $5,200 | $500 | $4,700 |
| 2022 | $186 | $5,100 | $500 | $4,600 |
| 2021 | $199 | $5,440 | $500 | $4,940 |
| 2020 | $199 | $5,440 | $500 | $4,940 |
| 2019 | $199 | $5,440 | $500 | $4,940 |
| 2018 | $199 | $5,440 | $0 | $0 |
| 2017 | $239 | $6,540 | $500 | $6,040 |
| 2014 | $239 | $6,540 | $500 | $6,040 |
| 2013 | -- | $5,960 | $500 | $5,460 |
Source: Public Records
Map
Nearby Homes
- 719 W Patton Ave
- 378 W Delano Ave
- 331 W Delano Ave
- 3734 Gaston Ave
- 501 Japonica St
- 3920 Oak St
- 303 Azalea Dr
- 3675 Whiting Ave
- 644 Iris Ln
- 4113 Oak St
- 3639 Whiting Ave
- 212 W Delano Ave
- 3827 Edgar D Nixon Ave
- 3616 Gaston Ave
- 3862 Happiness Ave
- 330 National St
- 131 Azalea Dr
- 210 Canna Dr
- 351 Collinwood Ave
- 203 W Woodland Dr
- 721 W April St
- 703 W April St
- 708 W Patton Ave
- 729 W April St
- 714 W Patton Ave
- 702 W Patton Ave
- 712 W April St
- 720 W Patton Ave
- 737 W April St
- 720 W April St
- 702 W April St
- 661 W April St
- 728 W April St
- 726 W Patton Ave
- 745 W April St
- 640 W Patton Ave
- 736 W April St
- 660 W April St
- 653 W April St
- 732 W Patton Ave