Estimated Value: $317,971 - $418,000
3
Beds
2
Baths
1,593
Sq Ft
$220/Sq Ft
Est. Value
About This Home
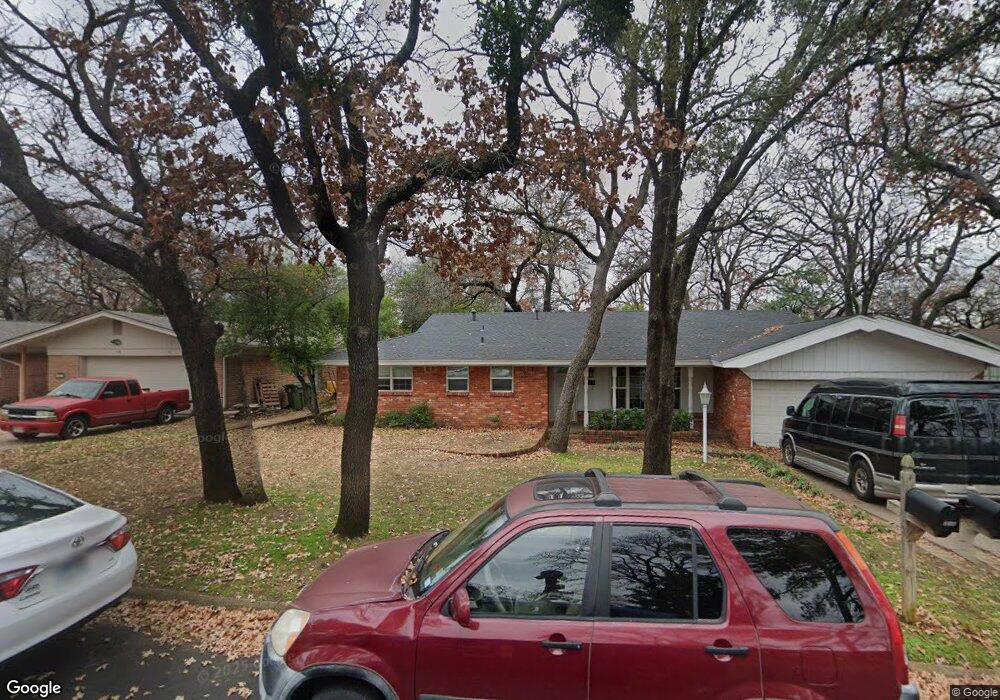
This home is located at 713 W Cheryl Ave, Hurst, TX 76053 and is currently estimated at $350,493, approximately $220 per square foot. 713 W Cheryl Ave is a home located in Tarrant County with nearby schools including Donna Park Elementary, Bedford Junior High School, and L.D. Bell High School.
Ownership History
Date
Name
Owned For
Owner Type
Purchase Details
Closed on
Sep 13, 2018
Sold by
Ortiz Ray A and Ortiz Jessica R
Bought by
Howk Steven C
Current Estimated Value
Home Financials for this Owner
Home Financials are based on the most recent Mortgage that was taken out on this home.
Original Mortgage
$237,590
Outstanding Balance
$207,211
Interest Rate
4.6%
Mortgage Type
VA
Estimated Equity
$143,282
Purchase Details
Closed on
Jul 14, 2004
Sold by
Lyon Fredric G
Bought by
Ortiz Ray A and Ortiz Jessica R
Home Financials for this Owner
Home Financials are based on the most recent Mortgage that was taken out on this home.
Original Mortgage
$107,000
Interest Rate
6.26%
Mortgage Type
Purchase Money Mortgage
Purchase Details
Closed on
Jun 4, 1997
Sold by
Lyon Fredric G and Lyon Helen L
Bought by
Lyon Fredric G and The Fredric G Lyon Revocable Living Tr
Create a Home Valuation Report for This Property
The Home Valuation Report is an in-depth analysis detailing your home's value as well as a comparison with similar homes in the area
Home Values in the Area
Average Home Value in this Area
Purchase History
| Date | Buyer | Sale Price | Title Company |
|---|---|---|---|
| Howk Steven C | -- | None Available | |
| Ortiz Ray A | -- | American Title | |
| Lyon Fredric G | -- | -- |
Source: Public Records
Mortgage History
| Date | Status | Borrower | Loan Amount |
|---|---|---|---|
| Open | Howk Steven C | $237,590 | |
| Previous Owner | Ortiz Ray A | $107,000 |
Source: Public Records
Tax History Compared to Growth
Tax History
| Year | Tax Paid | Tax Assessment Tax Assessment Total Assessment is a certain percentage of the fair market value that is determined by local assessors to be the total taxable value of land and additions on the property. | Land | Improvement |
|---|---|---|---|---|
| 2025 | $4,818 | $328,317 | $60,000 | $268,317 |
| 2024 | $4,818 | $328,317 | $60,000 | $268,317 |
| 2023 | $5,749 | $311,700 | $50,000 | $261,700 |
| 2022 | $6,007 | $268,322 | $50,000 | $218,322 |
| 2021 | $5,720 | $237,168 | $50,000 | $187,168 |
| 2020 | $5,507 | $228,893 | $50,000 | $178,893 |
| 2019 | $5,499 | $224,685 | $50,000 | $174,685 |
| 2018 | $2,706 | $132,435 | $20,000 | $112,435 |
| 2017 | $3,047 | $144,033 | $20,000 | $124,033 |
| 2016 | $2,770 | $142,521 | $20,000 | $122,521 |
| 2015 | $2,214 | $99,500 | $15,000 | $84,500 |
| 2014 | $2,214 | $99,500 | $15,000 | $84,500 |
Source: Public Records
Map
Nearby Homes
- 713 Edgehill Dr
- 632 Forest Ln
- 829 Joanna Dr
- 833 W Cheryl Ave
- 1145 Terrace Trail
- 820 Bedford Ct W
- 1208 Birch St
- 1204 Princess Ln
- 853 Royal Terrace
- 1001 Livingston Dr
- 1016 Billie Ruth Ln
- 1208 Karla Dr
- 400 Joanna Dr
- 916 Zelda Dr
- 913 Zelda Dr
- 420 Bedford Ct W
- 628 Elm St
- 708 Hurstview Dr
- 758 Briarwood Ln
- 756 Briarwood Ln
- 717 W Cheryl Ave
- 709 W Cheryl Ave
- 712 Joanna Dr
- 716 Joanna Dr
- 708 Joanna Dr
- 705 W Cheryl Ave
- 721 W Cheryl Ave
- 712 W Cheryl Ave
- 720 W Cheryl Ave
- 704 Joanna Dr
- 720 Joanna Dr
- 708 W Cheryl Ave
- 724 W Cheryl Ave
- 725 W Cheryl Ave
- 1009 Forest Oaks Ln
- 1005 Forest Oaks Ln
- 724 Joanna Dr
- 704 W Cheryl Ave
- 1001 Forest Oaks Ln
- 728 W Cheryl Ave