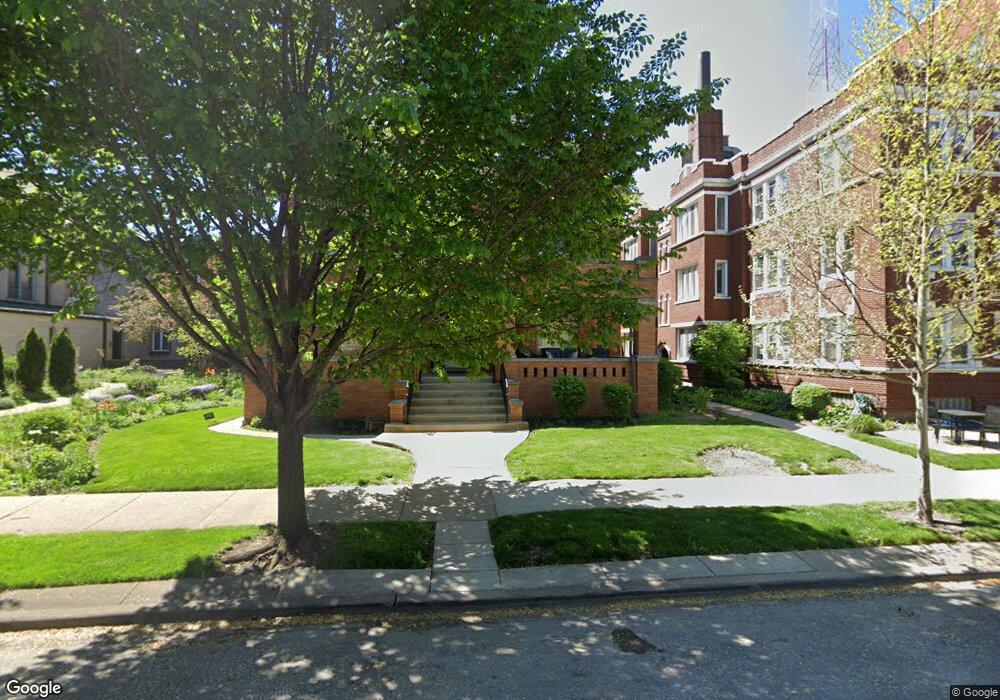
713 Washington Blvd Unit 1W Oak Park, IL 60302
Estimated Value: $313,000 - $362,000
2
Beds
--
Bath
9,786
Sq Ft
$34/Sq Ft
Est. Value
About This Home
This home is located at 713 Washington Blvd Unit 1W, Oak Park, IL 60302 and is currently estimated at $328,286, approximately $33 per square foot. 713 Washington Blvd Unit 1W is a home located in Cook County with nearby schools including Abraham Lincoln Elementary School, Gwendolyn Brooks Middle School, and Oak Park and River Forest High School.
Ownership History
Date
Name
Owned For
Owner Type
Purchase Details
Closed on
Jul 16, 2006
Sold by
Anderson Janet C
Bought by
Anderson Janet C and The Janet C Anderson Trust
Current Estimated Value
Purchase Details
Closed on
May 27, 2004
Sold by
Jancewicz Paul and Jancewicz Meghan Cahill
Bought by
Anderson Janet C
Home Financials for this Owner
Home Financials are based on the most recent Mortgage that was taken out on this home.
Original Mortgage
$236,000
Outstanding Balance
$107,564
Interest Rate
5%
Mortgage Type
Unknown
Estimated Equity
$220,722
Purchase Details
Closed on
Mar 28, 2001
Sold by
711 Washington Inc
Bought by
Jancewicz Paul and Cahill Jancewicz Meghan
Home Financials for this Owner
Home Financials are based on the most recent Mortgage that was taken out on this home.
Original Mortgage
$188,100
Interest Rate
6.99%
Create a Home Valuation Report for This Property
The Home Valuation Report is an in-depth analysis detailing your home's value as well as a comparison with similar homes in the area
Home Values in the Area
Average Home Value in this Area
Purchase History
| Date | Buyer | Sale Price | Title Company |
|---|---|---|---|
| Anderson Janet C | -- | None Available | |
| Anderson Janet C | $295,000 | Git | |
| Jancewicz Paul | $209,000 | -- |
Source: Public Records
Mortgage History
| Date | Status | Borrower | Loan Amount |
|---|---|---|---|
| Open | Anderson Janet C | $236,000 | |
| Previous Owner | Jancewicz Paul | $188,100 |
Source: Public Records
Tax History Compared to Growth
Tax History
| Year | Tax Paid | Tax Assessment Tax Assessment Total Assessment is a certain percentage of the fair market value that is determined by local assessors to be the total taxable value of land and additions on the property. | Land | Improvement |
|---|---|---|---|---|
| 2024 | $7,268 | $28,264 | $1,769 | $26,495 |
| 2023 | $6,412 | $28,264 | $1,769 | $26,495 |
| 2022 | $6,412 | $22,855 | $1,264 | $21,591 |
| 2021 | $6,309 | $22,854 | $1,263 | $21,591 |
| 2020 | $6,304 | $22,854 | $1,263 | $21,591 |
| 2019 | $7,693 | $26,224 | $1,137 | $25,087 |
| 2018 | $7,400 | $26,224 | $1,137 | $25,087 |
| 2017 | $7,277 | $26,224 | $1,137 | $25,087 |
| 2016 | $7,630 | $23,238 | $947 | $22,291 |
| 2015 | $6,758 | $23,238 | $947 | $22,291 |
| 2014 | $6,312 | $23,238 | $947 | $22,291 |
| 2013 | $7,896 | $28,769 | $947 | $27,822 |
Source: Public Records
Map
Nearby Homes
- 820 Washington Blvd Unit G
- 415 Wesley Ave Unit 21
- 415 Wesley Ave Unit 36
- 415 Wesley Ave Unit 24
- 854 Washington Blvd Unit 3
- 514 Wesley Ave
- 839 Madison St Unit 207
- 839 Madison St Unit 307
- 839 Madison St Unit 301
- 839 Madison St Unit 202
- 839 Madison St Unit 502
- 839 Madison St Unit 401
- 839 Madison St Unit 203
- 839 Madison St Unit 304
- 839 Madison St Unit 306
- 839 Madison St Unit 303
- 839 Madison St Unit 406
- 839 Madison St Unit 206
- 839 Madison St Unit 503
- 415 S East Ave
- 713 Washington Blvd Unit 3W
- 713 Washington Blvd Unit 2W
- 711 Washington Blvd Unit 2W
- 711 Washington Blvd Unit P1
- 711 Washington Blvd Unit G1
- 711 Washington Blvd Unit 2E
- 711 Washington Blvd Unit G3
- 711 Washington Blvd Unit 3E
- 711 Washington Blvd Unit 1E
- 711 Washington Blvd Unit G2
- 717 Washington Blvd Unit 1C
- 717 Washington Blvd Unit 3A
- 717 Washington Blvd Unit 2A
- 717 Washington Blvd Unit 2C
- 717 Washington Blvd Unit 3B
- 717 Washington Blvd Unit 1A
- 717 Washington Blvd Unit 2B
- 717 Washington Blvd Unit 1B
- 715 Washington Blvd Unit 2D
- 715 Washington Blvd Unit 3C