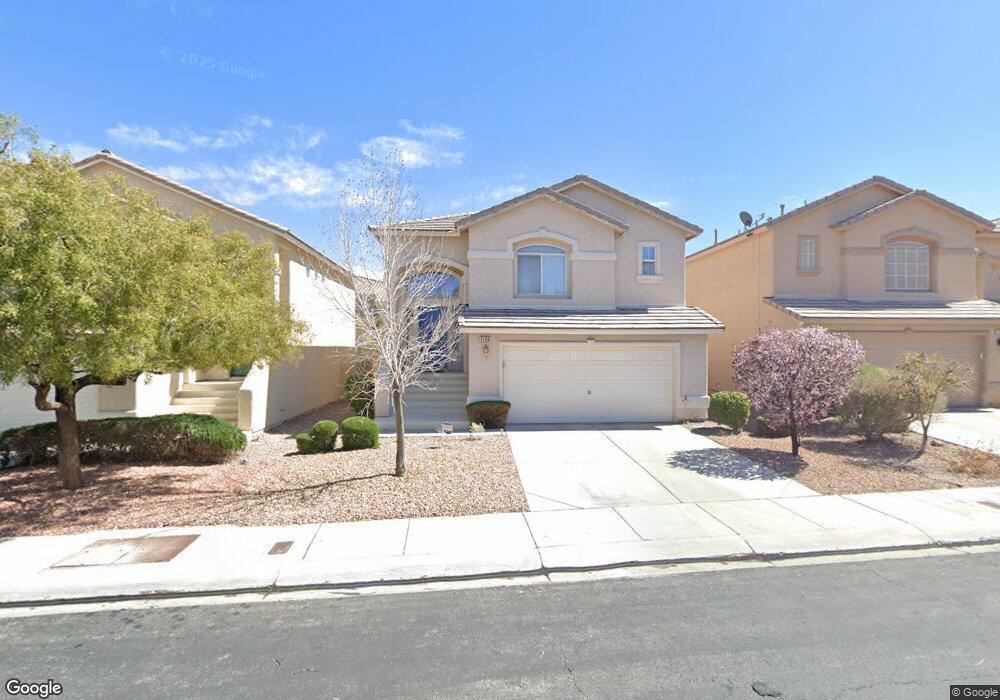
7130 Bird Cherry St Unit 2 Las Vegas, NV 89148
Estimated Value: $427,000 - $437,000
2
Beds
3
Baths
1,677
Sq Ft
$257/Sq Ft
Est. Value
About This Home
This home is located at 7130 Bird Cherry St Unit 2, Las Vegas, NV 89148 and is currently estimated at $431,310, approximately $257 per square foot. 7130 Bird Cherry St Unit 2 is a home located in Clark County with nearby schools including Wayne N. Tanaka Elementary School, Wilbur & Theresa Faiss Middle School, and Sierra Vista High School.
Ownership History
Date
Name
Owned For
Owner Type
Purchase Details
Closed on
Jan 30, 2007
Sold by
Javier Abigail G
Bought by
Desphy Jupiter Jacques and Desphy Abigail
Current Estimated Value
Home Financials for this Owner
Home Financials are based on the most recent Mortgage that was taken out on this home.
Original Mortgage
$217,000
Outstanding Balance
$140,054
Interest Rate
7.6%
Mortgage Type
New Conventional
Estimated Equity
$291,256
Purchase Details
Closed on
Aug 5, 2002
Sold by
Astoria R R 22 Llc
Bought by
Javier Abigail G
Home Financials for this Owner
Home Financials are based on the most recent Mortgage that was taken out on this home.
Original Mortgage
$161,350
Interest Rate
6.6%
Create a Home Valuation Report for This Property
The Home Valuation Report is an in-depth analysis detailing your home's value as well as a comparison with similar homes in the area
Home Values in the Area
Average Home Value in this Area
Purchase History
| Date | Buyer | Sale Price | Title Company |
|---|---|---|---|
| Desphy Jupiter Jacques | -- | Fidelity National Title | |
| Javier Abigail G | $169,849 | First American Title Co |
Source: Public Records
Mortgage History
| Date | Status | Borrower | Loan Amount |
|---|---|---|---|
| Open | Desphy Jupiter Jacques | $217,000 | |
| Closed | Javier Abigail G | $161,350 |
Source: Public Records
Tax History Compared to Growth
Tax History
| Year | Tax Paid | Tax Assessment Tax Assessment Total Assessment is a certain percentage of the fair market value that is determined by local assessors to be the total taxable value of land and additions on the property. | Land | Improvement |
|---|---|---|---|---|
| 2025 | $2,550 | $107,290 | $38,500 | $68,790 |
| 2024 | $2,089 | $107,290 | $38,500 | $68,790 |
| 2023 | $1,643 | $98,243 | $33,250 | $64,993 |
| 2022 | $2,215 | $87,402 | $28,000 | $59,402 |
| 2021 | $1,792 | $80,994 | $24,500 | $56,494 |
| 2020 | $1,661 | $79,407 | $23,450 | $55,957 |
| 2019 | $1,556 | $76,076 | $21,000 | $55,076 |
| 2018 | $1,485 | $69,239 | $16,450 | $52,789 |
| 2017 | $2,030 | $69,220 | $15,750 | $53,470 |
| 2016 | $1,643 | $61,541 | $11,900 | $49,641 |
| 2015 | $1,388 | $53,470 | $10,850 | $42,620 |
| 2014 | $1,535 | $44,474 | $6,300 | $38,174 |
Source: Public Records
Map
Nearby Homes
- 9050 W Warm Springs Rd Unit 1164
- 9050 W Warm Springs Rd Unit 1092
- 9050 W Warm Springs Rd Unit 2099
- 9249 Shellmont Ct
- 8970 Flying Frog Ave
- 8982 Leaping Pad Ct
- 7245 Pine Barrens St
- 7264 Morrison St
- 9119 Glennon Ave
- 9299 Adamshurst Ave
- 9272 Keaton Ave
- 7325 Ringquist St
- 9123 Hilverson Ave
- 7011 Azure Beach St
- 9100 Hombard Ave
- 6884 Stonetrace St
- 7064 Coventry Glenn Rd
- 10 Gulf Pines Ave
- 8970 Drew Valley Ct
- 9229 Millikan Ave
- 7136 Bird Cherry St
- 7124 Bird Cherry St
- 7118 Bird Cherry St
- 7142 Bird Cherry St
- 7112 Bird Cherry St
- 7112 Bird Cherry St Unit x
- 7148 Bird Cherry St
- 7129 Bird Cherry St Unit 2
- 7135 Bird Cherry St Unit 2
- 7123 Bird Cherry St Unit 2
- 7141 Bird Cherry St Unit 2
- 7117 Bird Cherry St Unit 2
- 7154 Bird Cherry St
- 7106 Bird Cherry St
- 7147 Bird Cherry St Unit 2
- 7111 Bird Cherry St
- 7160 Bird Cherry St
- 7153 Bird Cherry St
- 7105 Bird Cherry St
- 7128 Brassica Ct