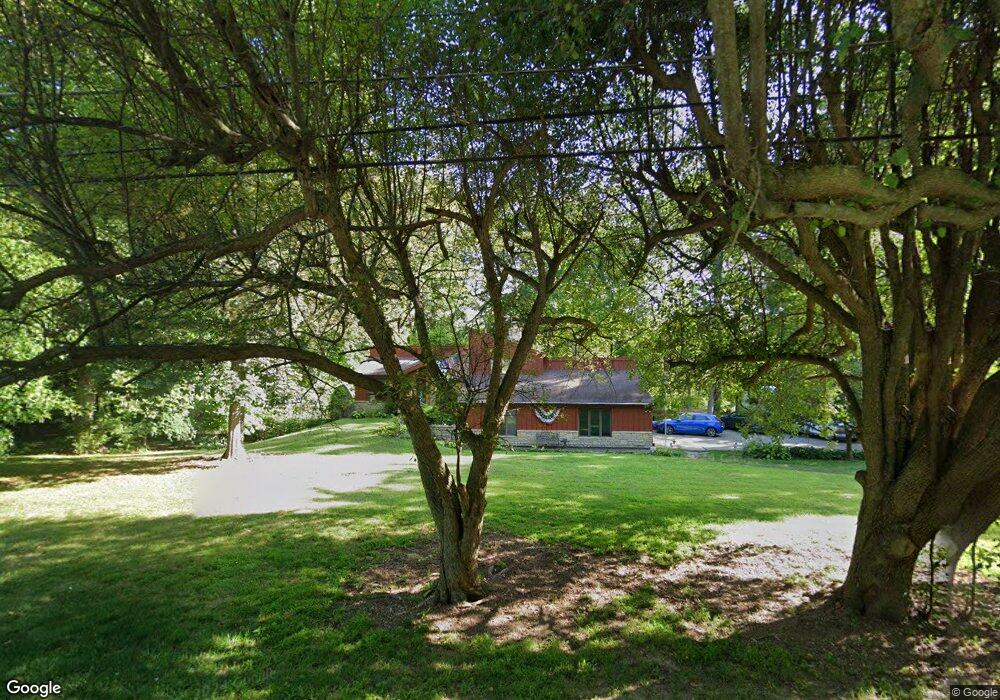
7130 Lithopolis Rd Carroll, OH 43112
Bloom NeighborhoodEstimated Value: $424,000 - $505,000
3
Beds
3
Baths
1,682
Sq Ft
$281/Sq Ft
Est. Value
About This Home
This home is located at 7130 Lithopolis Rd, Carroll, OH 43112 and is currently estimated at $473,247, approximately $281 per square foot. 7130 Lithopolis Rd is a home located in Fairfield County with nearby schools including Bloom Carroll Primary School, Bloom Carroll Intermediate School, and Bloom-Carroll Middle School.
Ownership History
Date
Name
Owned For
Owner Type
Purchase Details
Closed on
Apr 3, 2018
Sold by
Austin Angela M and Austin Robert A
Bought by
Frasure Tabitha and Frasure Bradley
Current Estimated Value
Home Financials for this Owner
Home Financials are based on the most recent Mortgage that was taken out on this home.
Original Mortgage
$213,000
Interest Rate
4.4%
Mortgage Type
New Conventional
Purchase Details
Closed on
Mar 24, 2016
Sold by
Miller Nelda J
Bought by
Austin Angela M and Austin Robert A
Home Financials for this Owner
Home Financials are based on the most recent Mortgage that was taken out on this home.
Original Mortgage
$250,000
Interest Rate
3.62%
Mortgage Type
VA
Create a Home Valuation Report for This Property
The Home Valuation Report is an in-depth analysis detailing your home's value as well as a comparison with similar homes in the area
Home Values in the Area
Average Home Value in this Area
Purchase History
| Date | Buyer | Sale Price | Title Company |
|---|---|---|---|
| Frasure Tabitha | $279,000 | Valmer Land Title Agency Box | |
| Austin Angela M | $250,000 | First Ohio Title Insurance |
Source: Public Records
Mortgage History
| Date | Status | Borrower | Loan Amount |
|---|---|---|---|
| Closed | Frasure Tabitha | $213,000 | |
| Closed | Austin Angela M | $250,000 |
Source: Public Records
Tax History Compared to Growth
Tax History
| Year | Tax Paid | Tax Assessment Tax Assessment Total Assessment is a certain percentage of the fair market value that is determined by local assessors to be the total taxable value of land and additions on the property. | Land | Improvement |
|---|---|---|---|---|
| 2024 | $10,421 | $126,470 | $25,290 | $101,180 |
| 2023 | $5,362 | $126,600 | $25,290 | $101,310 |
| 2022 | $5,404 | $126,600 | $25,290 | $101,310 |
| 2021 | $4,249 | $89,970 | $20,230 | $69,740 |
| 2020 | $4,288 | $89,970 | $20,230 | $69,740 |
| 2019 | $4,322 | $90,260 | $20,230 | $70,030 |
| 2018 | $4,048 | $69,850 | $16,990 | $52,860 |
| 2017 | $3,815 | $85,540 | $16,180 | $69,360 |
| 2016 | $3,856 | $85,540 | $16,180 | $69,360 |
| 2015 | $3,187 | $79,270 | $16,180 | $63,090 |
| 2014 | $3,057 | $79,270 | $16,180 | $63,090 |
| 2013 | $3,057 | $79,270 | $16,180 | $63,090 |
Source: Public Records
Map
Nearby Homes
- 839 Rockmill Rd NW
- 4180 Stone Hill Drive East NW
- 6556 Castlewood Dr NW
- 4400 Kauffman Rd NW
- 9263 Lithopolis Rd NW
- 410 N Wooster Way NW
- 3400 Mason Rd NW
- 2155 Carroll-Southern Rd NW
- 6415 Winchester Rd NW
- 3586 Mason Rd NW
- 4900 Pickerington Rd NW
- 3830 Mason Rd NW
- 53 S Beaver St
- 1980 Sitterley Rd NW
- 9655 Salem Church Rd NW
- 1915 Sitterley Rd NW
- 10 Mount Zion Rd NW
- 5771 Royalton Rd SW
- 5842 Feldon Ct NW
- 7450 Broad St NW
- 7130 Lithopolis Rd NW
- 7195 Lithopolis Rd
- 7095 Lithopolis Rd NW
- 7040 Lithopolis Rd
- 7040 Lithopolis Rd
- 7215 Lithopolis Rd
- 7039 Lithopolis Rd
- 7245 Lithopolis Rd
- 7245 Lithopolis Rd
- 7015 Lithopolis Rd
- 7260 Lithopolis Rd
- 7030 Lithopolis Rd
- 7297 Lithopolis Rd
- 7300 Lithopolis Rd
- 7297 Lithopolis Rd NW
- 6995 Lithopolis Rd
- 7330 Lithopolis Rd
- 7330 Lithopolis Rd
- 7330 Lithopolis Rd
- 7330 Lithopolis Rd