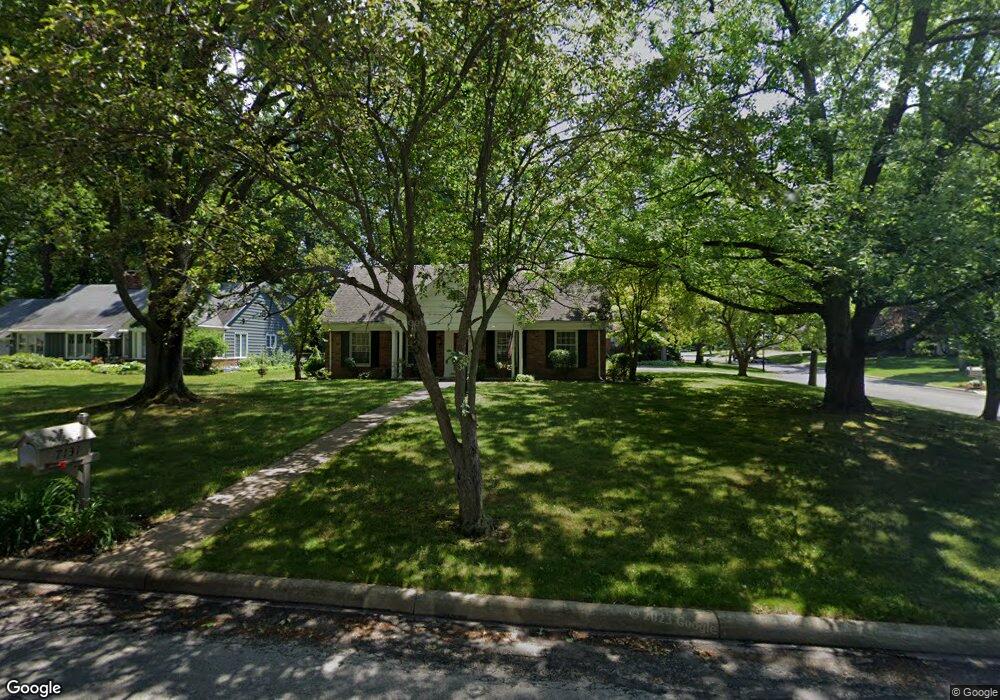
7131 Crabtree Ln Sylvania, OH 43560
Estimated Value: $336,000 - $403,000
4
Beds
3
Baths
2,532
Sq Ft
$145/Sq Ft
Est. Value
About This Home
This home is located at 7131 Crabtree Ln, Sylvania, OH 43560 and is currently estimated at $366,380, approximately $144 per square foot. 7131 Crabtree Ln is a home located in Lucas County with nearby schools including Maplewood Elementary School, Sylvania Arbor Hills Junior High School, and Sylvania Northview High School.
Ownership History
Date
Name
Owned For
Owner Type
Purchase Details
Closed on
Sep 13, 2001
Sold by
Carpenter Jeffrey L and Carpenter Sandra L
Bought by
Boudouris Gregory L and Boudouris Catherine G
Current Estimated Value
Home Financials for this Owner
Home Financials are based on the most recent Mortgage that was taken out on this home.
Original Mortgage
$204,250
Outstanding Balance
$80,052
Interest Rate
7.06%
Estimated Equity
$286,328
Purchase Details
Closed on
Jul 30, 1998
Sold by
Kearns Douglas E and Kearns Kimberly A
Bought by
Carpenter Jeffrey L and Carpenter Sandra L
Home Financials for this Owner
Home Financials are based on the most recent Mortgage that was taken out on this home.
Original Mortgage
$172,500
Interest Rate
7.03%
Purchase Details
Closed on
Aug 26, 1992
Sold by
Kosmo Edward
Purchase Details
Closed on
Sep 8, 1988
Sold by
Kosmo Edward and Kosmo Eleanor
Purchase Details
Closed on
Apr 20, 1988
Sold by
Kosmo Edward and Kosmo Eleanor
Create a Home Valuation Report for This Property
The Home Valuation Report is an in-depth analysis detailing your home's value as well as a comparison with similar homes in the area
Home Values in the Area
Average Home Value in this Area
Purchase History
| Date | Buyer | Sale Price | Title Company |
|---|---|---|---|
| Boudouris Gregory L | $215,000 | Louisville Title Agency For | |
| Carpenter Jeffrey L | $203,000 | Midland | |
| -- | $151,000 | -- | |
| -- | -- | -- | |
| -- | -- | -- |
Source: Public Records
Mortgage History
| Date | Status | Borrower | Loan Amount |
|---|---|---|---|
| Open | Boudouris Gregory L | $204,250 | |
| Closed | Carpenter Jeffrey L | $172,500 |
Source: Public Records
Tax History Compared to Growth
Tax History
| Year | Tax Paid | Tax Assessment Tax Assessment Total Assessment is a certain percentage of the fair market value that is determined by local assessors to be the total taxable value of land and additions on the property. | Land | Improvement |
|---|---|---|---|---|
| 2024 | $3,208 | $100,450 | $16,310 | $84,140 |
| 2023 | $6,008 | $81,410 | $14,455 | $66,955 |
| 2022 | $6,017 | $81,410 | $14,455 | $66,955 |
| 2021 | $6,139 | $81,410 | $14,455 | $66,955 |
| 2020 | $6,207 | $71,295 | $12,110 | $59,185 |
| 2019 | $5,981 | $71,295 | $12,110 | $59,185 |
| 2018 | $6,156 | $71,295 | $12,110 | $59,185 |
| 2017 | $6,792 | $73,885 | $11,270 | $62,615 |
| 2016 | $6,662 | $211,100 | $32,200 | $178,900 |
| 2015 | $6,280 | $211,100 | $32,200 | $178,900 |
| 2014 | $5,617 | $71,050 | $10,850 | $60,200 |
| 2013 | $5,617 | $71,050 | $10,850 | $60,200 |
Source: Public Records
Map
Nearby Homes
- 7030 Hickory Ridge Rd
- 5144 Franciscan Blvd
- 5310 Turnberry Ln
- 6641 Convent Blvd
- 4850 Tamworth Rd
- 7345 Country Commons Ln
- 5914 Winding Way Dr
- 9152 Mill St
- 4814 Sylvan Ct
- 6835 Brintwood Rd
- 6023 Brainard Dr
- 6584 Brint Rd
- 4731 Weldwood Ln
- 6046 Gillingham Dr
- 6922 Gettysburg Dr
- 6053 Gregory Dr
- 4902 Marble Cliff Blvd
- 7120 Grenlock Dr
- 20 Main Street Cir
- 6708 Gettysburg Dr
- 7121 Crabtree Ln
- 5428 Olde Post Rd
- 7120 Pine Birr Ln
- 7132 Crabtree Ln
- 5439 Olde Post Rd
- 5449 Olde Post Rd
- 7111 Crabtree Ln
- 5429 Olde Post Rd
- 7110 Pine Birr Ln
- 7120 Crabtree Ln
- 7101 Crabtree Ln
- 5419 Olde Post Rd
- 5461 Olde Post Rd
- 7131 Bent Oak Rd
- 7110 Crabtree Ln
- 7101 Pine Birr Ln
- 7131 Pine Birr Ln
- 7121 Pine Birr Ln Unit LOT29
- 7121 Pine Birr Ln
- 5504 Bent Oak Rd