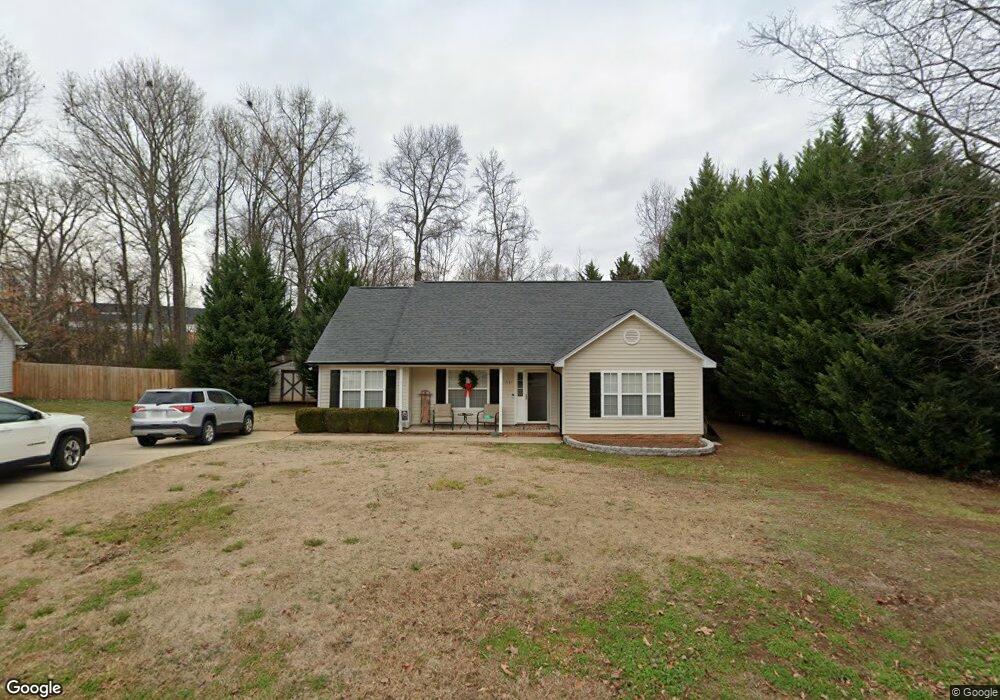
7131 Marlin St Gastonia, NC 28056
Estimated Value: $313,000 - $342,000
3
Beds
2
Baths
1,359
Sq Ft
$240/Sq Ft
Est. Value
About This Home
This home is located at 7131 Marlin St, Gastonia, NC 28056 and is currently estimated at $326,273, approximately $240 per square foot. 7131 Marlin St is a home located in Gaston County with nearby schools including New Hope Elementary School, Cramerton Middle School, and Forestview High School.
Ownership History
Date
Name
Owned For
Owner Type
Purchase Details
Closed on
Jan 12, 2015
Sold by
Beaty Brandon S
Bought by
Beaty Brandon S and Beaty Heather K
Current Estimated Value
Purchase Details
Closed on
Jan 5, 2015
Sold by
Beaty Brandon S
Bought by
Beaty Brandon S and Beaty Heather K
Purchase Details
Closed on
Mar 2, 2006
Sold by
Hud
Bought by
Beaty Brandon S
Home Financials for this Owner
Home Financials are based on the most recent Mortgage that was taken out on this home.
Original Mortgage
$98,800
Interest Rate
6.04%
Mortgage Type
Fannie Mae Freddie Mac
Purchase Details
Closed on
Oct 21, 2005
Sold by
Austin Rodney K and Austin Teresa L
Bought by
Hud
Purchase Details
Closed on
Jun 3, 2003
Sold by
Tsc Homes Inc
Bought by
Austin Rodney K and Austin Teresa L
Home Financials for this Owner
Home Financials are based on the most recent Mortgage that was taken out on this home.
Original Mortgage
$124,415
Interest Rate
5.87%
Mortgage Type
FHA
Create a Home Valuation Report for This Property
The Home Valuation Report is an in-depth analysis detailing your home's value as well as a comparison with similar homes in the area
Home Values in the Area
Average Home Value in this Area
Purchase History
| Date | Buyer | Sale Price | Title Company |
|---|---|---|---|
| Beaty Brandon S | -- | None Available | |
| Beaty Brandon S | -- | None Available | |
| Beaty Brandon S | -- | None Available | |
| Hud | $129,610 | -- | |
| Austin Rodney K | $125,500 | -- |
Source: Public Records
Mortgage History
| Date | Status | Borrower | Loan Amount |
|---|---|---|---|
| Previous Owner | Beaty Brandon S | $98,800 | |
| Previous Owner | Beaty Brandon S | $24,700 | |
| Previous Owner | Austin Rodney K | $124,415 |
Source: Public Records
Tax History Compared to Growth
Tax History
| Year | Tax Paid | Tax Assessment Tax Assessment Total Assessment is a certain percentage of the fair market value that is determined by local assessors to be the total taxable value of land and additions on the property. | Land | Improvement |
|---|---|---|---|---|
| 2025 | $2,669 | $259,400 | $28,000 | $231,400 |
| 2024 | $2,682 | $259,400 | $28,000 | $231,400 |
| 2023 | $2,737 | $259,400 | $28,000 | $231,400 |
| 2022 | $1,971 | $153,350 | $22,500 | $130,850 |
| 2021 | $2,001 | $153,350 | $22,500 | $130,850 |
| 2019 | $2,017 | $153,350 | $22,500 | $130,850 |
| 2018 | $1,841 | $136,872 | $22,400 | $114,472 |
| 2017 | $1,841 | $136,872 | $22,400 | $114,472 |
| 2016 | $1,841 | $136,872 | $0 | $0 |
| 2014 | $1,766 | $131,294 | $28,000 | $103,294 |
Source: Public Records
Map
Nearby Homes
- 7030 Dolphin St
- 5008 Patton Dr
- 201 Vanguard Ln Unit 13
- Melton Plan at Cramerton Mills - The Terraces
- Melton Basement Plan at Cramerton Mills - The Terraces
- Rankin Plan at Cramerton Mills - The Terraces
- Watts Plan at Cramerton Mills - The Terraces
- Hannah Plan at Cramerton Mills - The Terraces
- Rankin Basement Plan at Cramerton Mills - The Terraces
- 603 Banter Ln Unit 38
- Trenton Plan at Cramerton Mills - The Crossing
- Gray Plan at Cramerton Mills - The Crossing
- Watkins Plan at Cramerton Mills - The Crossing
- Gaston Plan at Cramerton Mills - The Crossing
- 203 Vanguard Ln Unit 14
- 515 Tates Trail Unit 39
- 606 Banter Ln Unit 30
- 612 Banter Ln Unit 32
- 205 Cramerton Mills Pkwy
- 5310 Old Course Dr
- 7127 Marlin St
- 7133 Marlin St
- 204 Hamrick Rd
- 7137 Marlin St
- 7137 Marlin St Unit 13
- 7125 Marlin St
- 7130 Marlin St
- 7134 Marlin St
- 7143 Marlin St
- 7123 Marlin St
- 7138 Marlin St
- 7122 Marlin St Unit 5
- 148 Hamrick Rd
- 7145 Marlin St
- 7118 Marlin St
- 309 Catfish Dr
- 4253 S New Hope Rd
- 140 Hamrick Rd
- 140 Hamrick Rd Unit 1010E
- 7043 Dolphin St