7132 Biltmore Way Unit 7132 Lithonia, GA 30058
Estimated Value: $206,000 - $225,000
4
Beds
4
Baths
1,418
Sq Ft
$152/Sq Ft
Est. Value
About This Home
This home is located at 7132 Biltmore Way Unit 7132, Lithonia, GA 30058 and is currently estimated at $214,859, approximately $151 per square foot. 7132 Biltmore Way Unit 7132 is a home located in DeKalb County with nearby schools including Princeton Elementary School, Stephenson Middle School, and Stephenson High School.
Ownership History
Date
Name
Owned For
Owner Type
Purchase Details
Closed on
Sep 21, 2017
Sold by
Dh & Track Llc
Bought by
Alston Michele
Current Estimated Value
Home Financials for this Owner
Home Financials are based on the most recent Mortgage that was taken out on this home.
Original Mortgage
$104,080
Outstanding Balance
$87,423
Interest Rate
4.12%
Mortgage Type
FHA
Estimated Equity
$127,436
Purchase Details
Closed on
Apr 28, 2017
Sold by
Hud & Housing Of Urban Dev
Bought by
Dh Track Llc
Purchase Details
Closed on
Nov 6, 2012
Sold by
Wells Fargo Bank Na
Bought by
Secretary Of Housing And Urban Developme
Purchase Details
Closed on
Aug 31, 2001
Sold by
Sharon Mcswain Homes Inc
Bought by
Duffus Juliette M
Home Financials for this Owner
Home Financials are based on the most recent Mortgage that was taken out on this home.
Original Mortgage
$128,350
Interest Rate
6.89%
Mortgage Type
FHA
Create a Home Valuation Report for This Property
The Home Valuation Report is an in-depth analysis detailing your home's value as well as a comparison with similar homes in the area
Home Values in the Area
Average Home Value in this Area
Purchase History
| Date | Buyer | Sale Price | Title Company |
|---|---|---|---|
| Alston Michele | $109,500 | -- | |
| Dh Track Llc | $57,066 | -- | |
| Secretary Of Housing And Urban Developme | $32,000 | -- | |
| Wells Fargo Bank Na | -- | -- | |
| Duffus Juliette M | $130,500 | -- |
Source: Public Records
Mortgage History
| Date | Status | Borrower | Loan Amount |
|---|---|---|---|
| Open | Alston Michele | $104,080 | |
| Previous Owner | Duffus Juliette M | $128,350 |
Source: Public Records
Tax History Compared to Growth
Tax History
| Year | Tax Paid | Tax Assessment Tax Assessment Total Assessment is a certain percentage of the fair market value that is determined by local assessors to be the total taxable value of land and additions on the property. | Land | Improvement |
|---|---|---|---|---|
| 2025 | $2,301 | $88,040 | $20,000 | $68,040 |
| 2024 | $2,294 | $86,720 | $20,000 | $66,720 |
| 2023 | $2,294 | $84,800 | $20,000 | $64,800 |
| 2022 | $1,715 | $65,400 | $7,200 | $58,200 |
| 2021 | $1,389 | $51,280 | $7,200 | $44,080 |
| 2020 | $1,304 | $47,400 | $7,200 | $40,200 |
| 2019 | $1,163 | $41,560 | $5,200 | $36,360 |
| 2018 | $1,224 | $41,560 | $5,200 | $36,360 |
| 2017 | $1,438 | $25,520 | $5,200 | $20,320 |
| 2016 | $1,435 | $25,400 | $1,880 | $23,520 |
| 2014 | $978 | $14,680 | $1,880 | $12,800 |
Source: Public Records
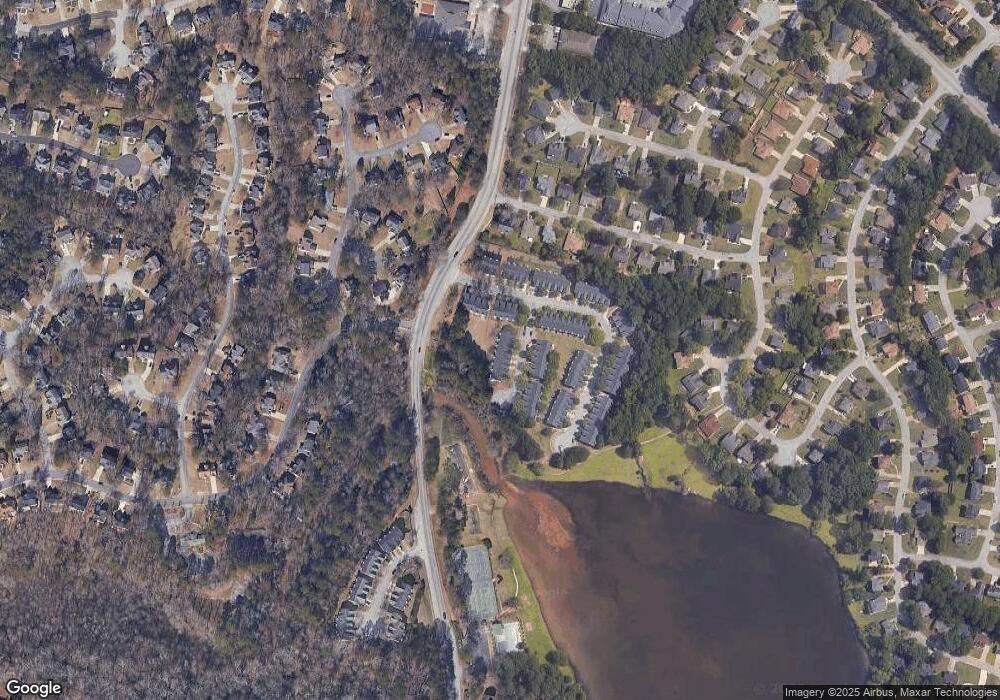
Map
Nearby Homes
- 7129 Biltmore Way
- 7049 Crestwood Place Unit 1
- 525 Crestwood Ct
- 486 Crestwood Ct
- 500 Chimney House Ct
- 732 Mountain Oaks Pkwy
- 606 Shadow Oaks Dr
- 401 N Deshong Rd
- 692 Shore Overlook
- 381 Registry Bluff
- 415 N Deshong Rd
- 754 Shore Dr
- 826 Shore Dr
- 392 Brookwater Ct
- 7039 Rockbridge Rd
- 1168 Stephenson Rd
- 7249 Misty Harbor Ct
- 6908 Registry Chase
- 7071 Deshon Hills Ln
- 460 Heathrow Way
- 7134 Biltmore Way
- 7132 Biltmore Way
- 7136 Biltmore Way
- 7130 Biltmore Way Unit 1
- 7130 Biltmore Way
- 7128 Biltmore Way
- 7126 Biltmore Way
- 7126 Biltmore Way
- 7019 Biltmore Trace
- 7021 Biltmore Trace
- 7124 Biltmore Way
- 7017 Biltmore Trace
- 7015 Biltmore Trace
- 7015 Biltmore Trace
- 7122 Biltmore Way
- 7009 Biltmore Trace
- 7033 Biltmore Trace
- 7135 Biltmore Way
- 7133 Biltmore Way
- 7137 Biltmore Way