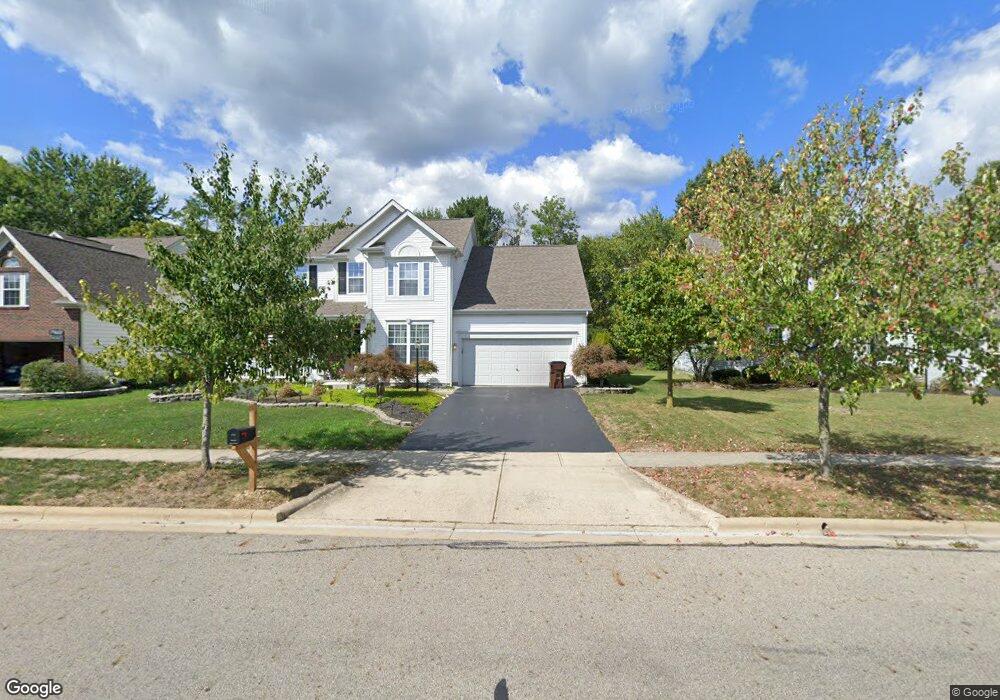
7133 Upper Cambridge Way Westerville, OH 43082
Genoa NeighborhoodEstimated Value: $573,000 - $708,000
4
Beds
3
Baths
3,131
Sq Ft
$205/Sq Ft
Est. Value
About This Home
This home is located at 7133 Upper Cambridge Way, Westerville, OH 43082 and is currently estimated at $643,352, approximately $205 per square foot. 7133 Upper Cambridge Way is a home located in Delaware County with nearby schools including Fouse Elementary School, Genoa Middle School, and Westerville Central High School.
Ownership History
Date
Name
Owned For
Owner Type
Purchase Details
Closed on
Feb 18, 2009
Sold by
Nationstar Mortgage Llc
Bought by
Walujo Beny and Pham Anita
Current Estimated Value
Home Financials for this Owner
Home Financials are based on the most recent Mortgage that was taken out on this home.
Original Mortgage
$251,419
Interest Rate
5.11%
Mortgage Type
FHA
Purchase Details
Closed on
Jan 22, 2009
Sold by
Lynch David L
Bought by
Nationstar Mortgage Llc
Home Financials for this Owner
Home Financials are based on the most recent Mortgage that was taken out on this home.
Original Mortgage
$251,419
Interest Rate
5.11%
Mortgage Type
FHA
Purchase Details
Closed on
Oct 29, 2004
Sold by
M/I Homes Of Central Ohio Llc
Bought by
Lynch David L and Lynch Linda L
Home Financials for this Owner
Home Financials are based on the most recent Mortgage that was taken out on this home.
Original Mortgage
$331,900
Interest Rate
4.99%
Mortgage Type
Purchase Money Mortgage
Create a Home Valuation Report for This Property
The Home Valuation Report is an in-depth analysis detailing your home's value as well as a comparison with similar homes in the area
Home Values in the Area
Average Home Value in this Area
Purchase History
| Date | Buyer | Sale Price | Title Company |
|---|---|---|---|
| Walujo Beny | $260,100 | Allodial Title Reo | |
| Nationstar Mortgage Llc | $247,500 | None Available | |
| Lynch David L | $415,000 | -- |
Source: Public Records
Mortgage History
| Date | Status | Borrower | Loan Amount |
|---|---|---|---|
| Previous Owner | Walujo Beny | $251,419 | |
| Previous Owner | Lynch David L | $331,900 | |
| Closed | Lynch David L | $82,900 |
Source: Public Records
Tax History Compared to Growth
Tax History
| Year | Tax Paid | Tax Assessment Tax Assessment Total Assessment is a certain percentage of the fair market value that is determined by local assessors to be the total taxable value of land and additions on the property. | Land | Improvement |
|---|---|---|---|---|
| 2024 | $9,882 | $188,620 | $34,130 | $154,490 |
| 2023 | $9,689 | $188,620 | $34,130 | $154,490 |
| 2022 | $9,471 | $141,860 | $24,500 | $117,360 |
| 2021 | $9,547 | $141,860 | $24,500 | $117,360 |
| 2020 | $9,586 | $141,860 | $24,500 | $117,360 |
| 2019 | $9,002 | $126,560 | $24,500 | $102,060 |
| 2018 | $8,627 | $126,560 | $24,500 | $102,060 |
| 2017 | $8,029 | $105,000 | $21,840 | $83,160 |
| 2016 | $7,687 | $105,000 | $21,840 | $83,160 |
| 2015 | $7,626 | $105,000 | $21,840 | $83,160 |
| 2014 | $7,534 | $105,000 | $21,840 | $83,160 |
| 2013 | $7,488 | $105,000 | $21,840 | $83,160 |
Source: Public Records
Map
Nearby Homes
- 7546 Upper Cambridge Way
- 5611 Genoa Farms Blvd
- 6623 Henschen Cir
- 7553 Slane Ridge Dr
- 6251 Steinbeck Way
- 7031 Ellison Dr
- 6086 Hemingway Place
- 6050 Medallion Dr W
- 6410 Steinbeck Way
- 7216 Big Walnut Rd
- 0 Paul Rd Unit 225001038
- 5983 Congressional Dr
- 5015 Bespoke Ct
- 7581 Lanetta Ln
- 6014 Commonwealth Dr
- 7969 Linksview Cir Unit 7969
- 7268 Clancy Way
- 7923 Big Walnut Rd
- 5462 Ketterington Ln
- 5279 Slater Ridge
- 7121 Upper Cambridge Way
- 7143 Upper Cambridge Way
- 7109 Upper Cambridge Way
- 7153 Upper Cambridge Way
- 7148 Upper Cambridge Way
- 7132 Upper Cambridge Way
- 7097 Upper Cambridge Way
- 7120 Upper Cambridge Way
- 7163 Upper Cambridge Way
- 5761 S Old 3c Rd
- 5797 S Old 3c Hwy
- 5761 S Old 3c Hwy
- 7180 Upper Cambridge Way
- 7083 Upper Cambridge Way
- 5741 S Old 3c Hwy
- 7177 Upper Cambridge Way
- 5771 S Old 3c Hwy
- 5825 S Old 3c Hwy
- 5754 Chiddingstone Ln
- 5833 S Old 3c Hwy