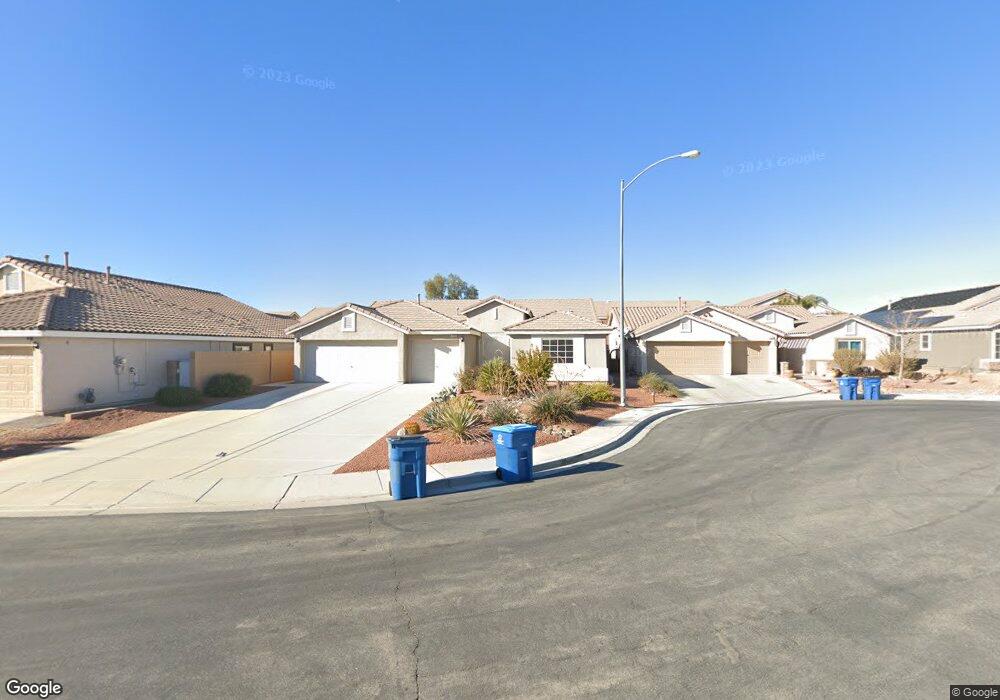
7133 White Blanket Ct North Las Vegas, NV 89084
Aliante NeighborhoodEstimated Value: $436,000 - $521,000
3
Beds
2
Baths
1,970
Sq Ft
$251/Sq Ft
Est. Value
About This Home
This home is located at 7133 White Blanket Ct, North Las Vegas, NV 89084 and is currently estimated at $495,138, approximately $251 per square foot. 7133 White Blanket Ct is a home located in Clark County with nearby schools including Don E. Hayden Elementary School, Ruby Duncan Elementary School, and Brian & Teri Cram Middle School.
Ownership History
Date
Name
Owned For
Owner Type
Purchase Details
Closed on
Oct 25, 2011
Sold by
Secretary Of Housing & Urban Development
Bought by
Jirus James R and Jirus Regina E
Current Estimated Value
Home Financials for this Owner
Home Financials are based on the most recent Mortgage that was taken out on this home.
Original Mortgage
$104,000
Outstanding Balance
$70,918
Interest Rate
4.02%
Mortgage Type
New Conventional
Estimated Equity
$424,220
Purchase Details
Closed on
Jun 14, 2010
Sold by
Gmac Mortgage Llc
Bought by
The Secretary Of Housing & Urban Develop
Purchase Details
Closed on
Feb 28, 2008
Sold by
D R Horton Inc
Bought by
Almaraz Ruben and Almaraz Ruby
Home Financials for this Owner
Home Financials are based on the most recent Mortgage that was taken out on this home.
Original Mortgage
$278,319
Interest Rate
5.64%
Mortgage Type
FHA
Create a Home Valuation Report for This Property
The Home Valuation Report is an in-depth analysis detailing your home's value as well as a comparison with similar homes in the area
Home Values in the Area
Average Home Value in this Area
Purchase History
| Date | Buyer | Sale Price | Title Company |
|---|---|---|---|
| Jirus James R | $131,500 | Nevada Title Las Vegas | |
| The Secretary Of Housing & Urban Develop | $308,572 | Lsi Title Agency Inc | |
| Gmac Mortgage Llc | $308,572 | Accommodation | |
| Almaraz Ruben | $282,687 | Dhi Title |
Source: Public Records
Mortgage History
| Date | Status | Borrower | Loan Amount |
|---|---|---|---|
| Open | Jirus James R | $104,000 | |
| Previous Owner | Almaraz Ruben | $278,319 |
Source: Public Records
Tax History Compared to Growth
Tax History
| Year | Tax Paid | Tax Assessment Tax Assessment Total Assessment is a certain percentage of the fair market value that is determined by local assessors to be the total taxable value of land and additions on the property. | Land | Improvement |
|---|---|---|---|---|
| 2025 | $2,856 | $164,460 | $40,950 | $123,510 |
| 2024 | $2,774 | $164,460 | $40,950 | $123,510 |
| 2023 | $2,774 | $151,822 | $36,400 | $115,422 |
| 2022 | $2,693 | $137,290 | $31,500 | $105,790 |
| 2021 | $2,615 | $118,481 | $27,300 | $91,181 |
| 2020 | $2,535 | $117,018 | $26,950 | $90,068 |
| 2019 | $2,462 | $113,768 | $25,550 | $88,218 |
| 2018 | $2,390 | $96,748 | $21,000 | $75,748 |
| 2017 | $3,082 | $91,873 | $18,900 | $72,973 |
| 2016 | $2,263 | $83,125 | $15,400 | $67,725 |
| 2015 | $2,258 | $73,250 | $14,000 | $59,250 |
| 2014 | $2,188 | $56,224 | $10,500 | $45,724 |
Source: Public Records
Map
Nearby Homes
- 7175 Steubling Glen St
- 7114 Superstar St
- 333 Largo Vista Ct
- 0 N Commerce St
- 6940 Whispering Falls Dr
- 37 Buffalo Gap Ct
- 128 Pollentia Ave
- 410 Horse Pointe Ave
- 105 Pollentia Ave
- 984 Brilliant Meadow Ave
- 1010 Belton Lake Ave
- 1009 Belton Lake Ave
- 6729 Montezuma Castle Ln
- 6643 Montezuma Castle Ln
- 6738 Cinnabar Coast Ln
- 1130 E Dorrell Ln
- 7064 Port Stephens St
- 7060 Port Stephens St
- 7056 Port Stephens St
- 7052 Port Stephens St
- 7129 White Blanket Ct
- 7137 White Blanket Ct
- 7134 Wilderness Pack Ct
- 7125 White Blanket Ct
- 7130 Wilderness Pack Ct
- 7141 White Blanket Ct
- 7138 Wilderness Pack Ct
- 7126 Wilderness Pack Ct
- 7138 White Blanket Ct
- 7134 White Blanket Ct
- 7142 White Blanket Ct
- 7130 White Blanket Ct
- 7142 Wilderness Pack Ct
- 7126 White Blanket Ct
- 105 Hunters Paradise Ave
- 109 Hunters Paradise Ave
- 95 Hunters Paradise Ave
- 113 Hunters Paradise Ave
- 7129 Wilderness Pack Ct
- 7141 Goldfield St