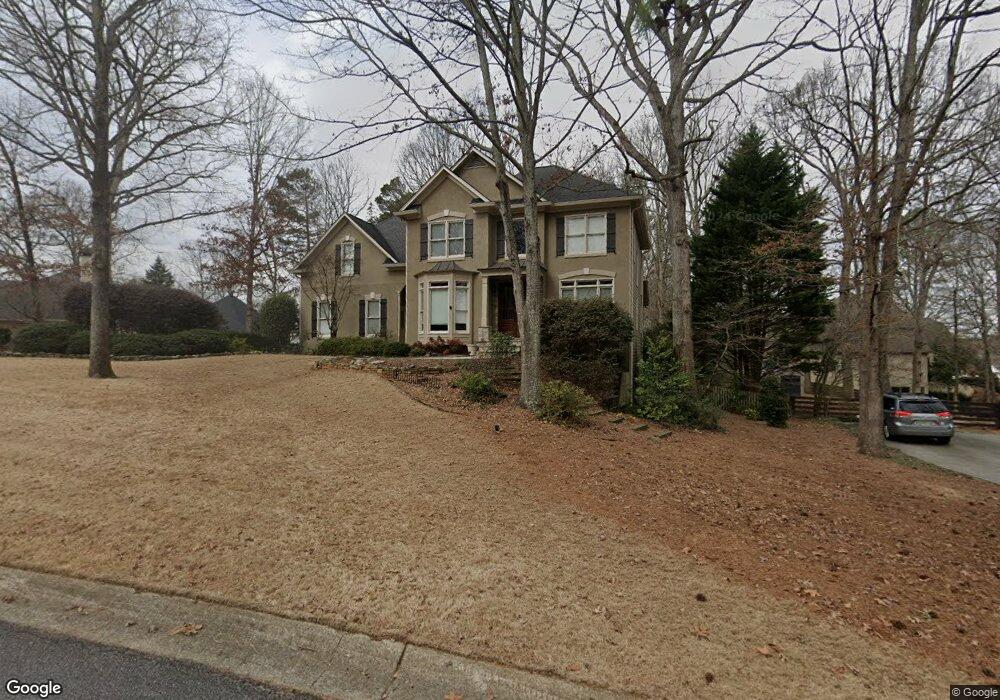
7135 Ridge Forest Walk Cumming, GA 30040
Estimated Value: $628,000 - $747,000
4
Beds
4
Baths
2,569
Sq Ft
$268/Sq Ft
Est. Value
About This Home
This home is located at 7135 Ridge Forest Walk, Cumming, GA 30040 and is currently estimated at $687,303, approximately $267 per square foot. 7135 Ridge Forest Walk is a home located in Forsyth County with nearby schools including DeSana Middle School, Denmark High School, and Montessori at Vickery.
Ownership History
Date
Name
Owned For
Owner Type
Purchase Details
Closed on
Aug 28, 2000
Sold by
Youngblood John P and Youngblood Karen
Bought by
Smith Jeffrey R and Smith Julie A
Current Estimated Value
Home Financials for this Owner
Home Financials are based on the most recent Mortgage that was taken out on this home.
Original Mortgage
$208,000
Outstanding Balance
$71,880
Interest Rate
7.37%
Mortgage Type
Stand Alone Refi Refinance Of Original Loan
Estimated Equity
$615,423
Purchase Details
Closed on
Aug 31, 1999
Sold by
Schmidt Michael U and Schmidt Stefanija
Bought by
Youngblood John P and Youngblood Karen
Home Financials for this Owner
Home Financials are based on the most recent Mortgage that was taken out on this home.
Original Mortgage
$203,200
Interest Rate
7.5%
Mortgage Type
New Conventional
Purchase Details
Closed on
Oct 15, 1996
Sold by
Sharp Devel Inc
Bought by
Schmidt Michael Stefanija
Create a Home Valuation Report for This Property
The Home Valuation Report is an in-depth analysis detailing your home's value as well as a comparison with similar homes in the area
Home Values in the Area
Average Home Value in this Area
Purchase History
| Date | Buyer | Sale Price | Title Company |
|---|---|---|---|
| Smith Jeffrey R | $260,000 | -- | |
| Youngblood John P | $254,000 | -- | |
| Schmidt Michael Stefanija | $228,400 | -- |
Source: Public Records
Mortgage History
| Date | Status | Borrower | Loan Amount |
|---|---|---|---|
| Open | Smith Jeffrey R | $208,000 | |
| Previous Owner | Youngblood John P | $203,200 | |
| Closed | Schmidt Michael Stefanija | $0 |
Source: Public Records
Tax History Compared to Growth
Tax History
| Year | Tax Paid | Tax Assessment Tax Assessment Total Assessment is a certain percentage of the fair market value that is determined by local assessors to be the total taxable value of land and additions on the property. | Land | Improvement |
|---|---|---|---|---|
| 2025 | $5,523 | $287,244 | $64,000 | $223,244 |
| 2024 | $5,523 | $280,704 | $60,000 | $220,704 |
| 2023 | $4,553 | $243,592 | $60,000 | $183,592 |
| 2022 | $4,647 | $163,096 | $40,000 | $123,096 |
| 2021 | $4,018 | $163,096 | $40,000 | $123,096 |
| 2020 | $3,828 | $153,848 | $30,000 | $123,848 |
| 2019 | $3,785 | $151,480 | $30,000 | $121,480 |
| 2018 | $3,509 | $137,472 | $30,000 | $107,472 |
| 2017 | $3,302 | $127,052 | $30,000 | $97,052 |
| 2016 | $3,175 | $121,052 | $24,000 | $97,052 |
| 2015 | $3,004 | $112,692 | $20,000 | $92,692 |
| 2014 | $2,688 | $104,836 | $20,000 | $84,836 |
Source: Public Records
Map
Nearby Homes
- 6410 Oak Valley Dr
- 6225 Oak Valley Ct
- 7210 Winderlea Ln
- 7310 Winderlea Ln
- Kendrick Plan at Courtyards at Traditions
- Redford Plan at Courtyards at Traditions
- Newman Plan at Courtyards at Traditions
- 7270 Stoller Dr
- 7330 Stoller Dr
- 6110 Carington Way
- 6085 Carington Way
- 7130 Winderlea Ln
- 7235 Stoller Dr
- 7270 Margate Ct
- 3915 Dorchester Ln
- 3211 Glen Wallace Dr
- 3910 Redwood Dr
- 2945 Greyhawk Ln Unit 3
- 2951 Greyhawk Ln
- 2913 Greyhawk Ln
- 7145 Ridge Forest Walk
- 7115 Ridge Forest Walk
- 6350 Oak Valley Dr
- 7055 Ridge Forest Walk
- 0 Oak Valley Dr Unit 8680747
- 0 Oak Valley Dr Unit 8641147
- 0 Oak Valley Dr Unit 8530903
- 0 Oak Valley Dr Unit 8679192
- 0 Oak Valley Dr Unit 8976666
- 0 Oak Valley Dr Unit 9023902
- 0 Oak Valley Dr Unit 8740639
- 0 Oak Valley Dr Unit 8884909
- 0 Oak Valley Dr Unit 3153620
- 0 Oak Valley Dr Unit 7052072
- 0 Oak Valley Dr Unit 7295511
- 0 Oak Valley Dr Unit 7628620
- 7150 Ridge Forest Walk
- 7140 Ridge Forest Walk
- 6340 Oak Valley Dr
- 0 Green Oak Ridge Unit 8557754