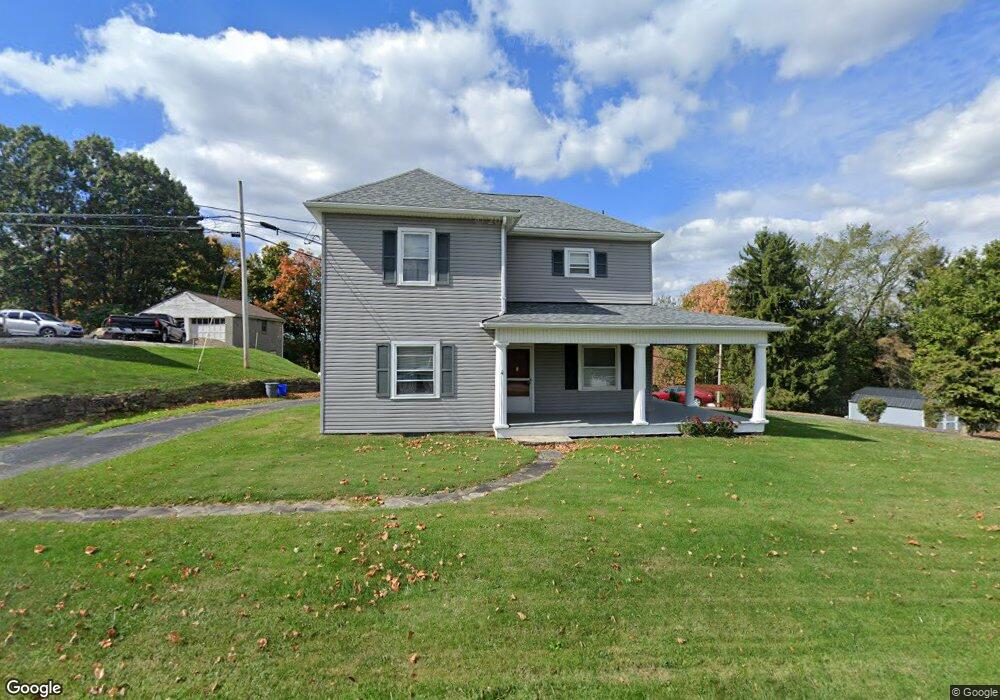
71350 Colerain Rd Bridgeport, OH 43912
Estimated Value: $154,493 - $217,000
3
Beds
1
Bath
1,664
Sq Ft
$108/Sq Ft
Est. Value
About This Home
This home is located at 71350 Colerain Rd, Bridgeport, OH 43912 and is currently estimated at $179,873, approximately $108 per square foot. 71350 Colerain Rd is a home located in Belmont County with nearby schools including Anna Marie Ayers Elementary School, Martins Ferry Middle School, and Martins Ferry High School.
Ownership History
Date
Name
Owned For
Owner Type
Purchase Details
Closed on
Aug 11, 1995
Sold by
Reynolds Phillip James
Bought by
Reynolds Phillip James
Current Estimated Value
Purchase Details
Closed on
Sep 27, 1994
Sold by
Sabol Fred E
Bought by
Sabol Fred E
Purchase Details
Closed on
Jan 1, 1986
Sold by
Sabol Fred E and Sabol Kathleen M
Bought by
Sabol Fred E and Sabol Kathleen M
Create a Home Valuation Report for This Property
The Home Valuation Report is an in-depth analysis detailing your home's value as well as a comparison with similar homes in the area
Home Values in the Area
Average Home Value in this Area
Purchase History
| Date | Buyer | Sale Price | Title Company |
|---|---|---|---|
| Reynolds Phillip James | $60,000 | -- | |
| Sabol Fred E | -- | -- | |
| Sabol Fred E | -- | -- |
Source: Public Records
Tax History Compared to Growth
Tax History
| Year | Tax Paid | Tax Assessment Tax Assessment Total Assessment is a certain percentage of the fair market value that is determined by local assessors to be the total taxable value of land and additions on the property. | Land | Improvement |
|---|---|---|---|---|
| 2024 | $1,414 | $39,580 | $3,560 | $36,020 |
| 2023 | $1,052 | $27,540 | $3,560 | $23,980 |
| 2022 | $1,052 | $27,534 | $3,556 | $23,978 |
| 2021 | $1,046 | $27,538 | $3,560 | $23,978 |
| 2020 | $967 | $23,940 | $3,090 | $20,850 |
| 2019 | $970 | $23,940 | $3,090 | $20,850 |
| 2018 | $991 | $23,940 | $3,090 | $20,850 |
| 2017 | $897 | $21,140 | $3,170 | $17,970 |
| 2016 | $901 | $21,140 | $3,170 | $17,970 |
| 2015 | $907 | $21,140 | $3,170 | $17,970 |
| 2014 | $885 | $21,590 | $2,880 | $18,710 |
| 2013 | $848 | $21,590 | $2,880 | $18,710 |
Source: Public Records
Map
Nearby Homes
- 70798 Lollini Rd
- 53760 Farmington Rd
- 53979 Colerain Pike
- 71850 Colerain Rd
- 71900 Cope St
- 70610 Chermont Rd
- 70571 Pine Hollow Rd
- 70540 Colerain Rd
- 69657 Chermont Rd
- 55379 Barnes Rd
- 69895 Woods Rd
- 0 Terra Ridge Ln
- 68960 Pine Terrace Rd
- 73881 Colerain Mount Pleasant Rd
- 70392 Barton Rd
- 54980 Maple Ave
- 55273 Poplar Ave
- 68511 Liston Ave
- 56745 Ferryview Rd
- 69282 Zelda Ave
- 71340 Colerain Rd
- 71378 Colerain Rd
- 71375 Colerain Rd
- 71381 Colerain Rd
- 71300 Colerain Rd
- 71300 Barton Colerain Rd
- 71300 Barton-Colerain Rd
- 54015 Brackin Rd
- 54025 Brackin Rd
- 54084 Brackin Rd
- 71401 Colerain Rd
- 54059 Brackin Rd
- 54061 Brackin Rd
- 71252 Colerain Rd
- 54100 Brackin Rd
- 71479 Colerain Rd
- 71236 Colerain Rd
- 54159 Brackin Rd
- 71501 Colerain Rd
- 54160 Bracken Rd