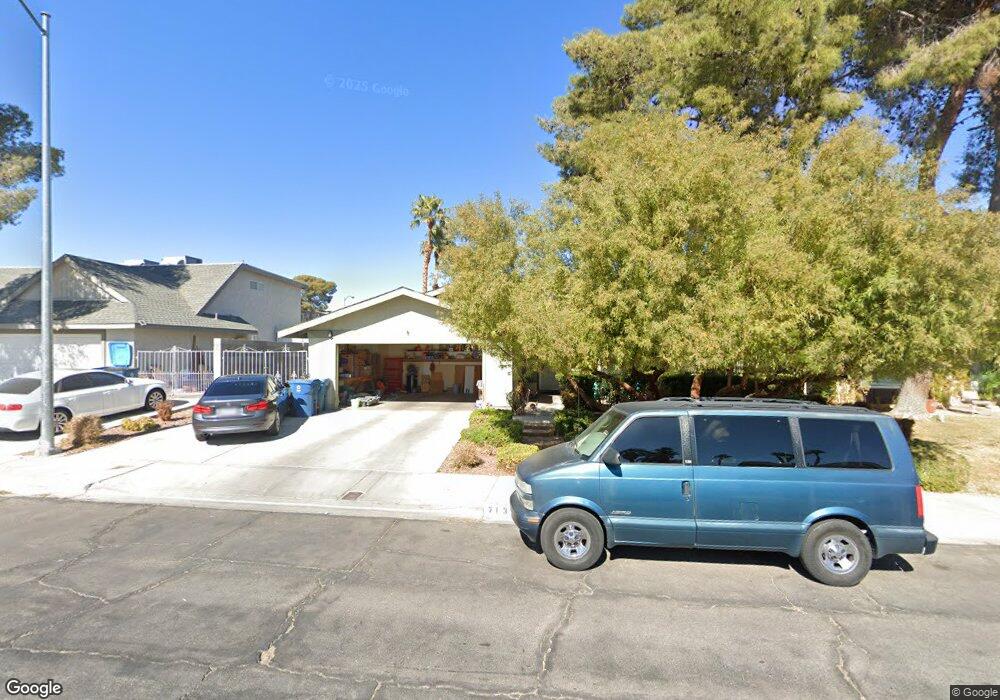
7136 Southpark Ct Las Vegas, NV 89147
Estimated Value: $372,680 - $387,000
4
Beds
2
Baths
1,337
Sq Ft
$283/Sq Ft
Est. Value
About This Home
This home is located at 7136 Southpark Ct, Las Vegas, NV 89147 and is currently estimated at $378,920, approximately $283 per square foot. 7136 Southpark Ct is a home located in Clark County with nearby schools including Frank Kim Elementary School, Clifford J Lawrence Junior High School, and Durango High School.
Ownership History
Date
Name
Owned For
Owner Type
Purchase Details
Closed on
Nov 21, 2007
Sold by
Logan Charles W and Logan Rojean A
Bought by
Logan Charles W and Logan Rojean A
Current Estimated Value
Purchase Details
Closed on
Jun 3, 2005
Sold by
Jobe Nick James and Jobe Kasuko
Bought by
Logan Charles W and Logan Rojean A
Purchase Details
Closed on
Nov 15, 1999
Sold by
Jobe Nick J and Jobe Kazuko M
Bought by
Jobe Nick James and Revoc Jobe 1999 Revoc
Create a Home Valuation Report for This Property
The Home Valuation Report is an in-depth analysis detailing your home's value as well as a comparison with similar homes in the area
Home Values in the Area
Average Home Value in this Area
Purchase History
| Date | Buyer | Sale Price | Title Company |
|---|---|---|---|
| Logan Charles W | -- | None Available | |
| Logan Charles W | $178,000 | Stewart Title Of Nevada | |
| Jobe Nick James | -- | -- |
Source: Public Records
Tax History Compared to Growth
Tax History
| Year | Tax Paid | Tax Assessment Tax Assessment Total Assessment is a certain percentage of the fair market value that is determined by local assessors to be the total taxable value of land and additions on the property. | Land | Improvement |
|---|---|---|---|---|
| 2025 | $1,165 | $60,749 | $38,150 | $22,599 |
| 2024 | $1,165 | $60,749 | $38,150 | $22,599 |
| 2023 | $1,165 | $55,778 | $33,250 | $22,528 |
| 2022 | $1,131 | $49,485 | $28,350 | $21,135 |
| 2021 | $1,098 | $46,081 | $25,550 | $20,531 |
| 2020 | $1,063 | $45,317 | $24,500 | $20,817 |
| 2019 | $1,032 | $43,743 | $22,750 | $20,993 |
| 2018 | $1,002 | $41,175 | $20,650 | $20,525 |
| 2017 | $1,164 | $39,679 | $18,550 | $21,129 |
| 2016 | $950 | $35,612 | $13,650 | $21,962 |
| 2015 | $947 | $32,899 | $10,850 | $22,049 |
| 2014 | $918 | $30,364 | $8,400 | $21,964 |
Source: Public Records
Map
Nearby Homes
- 4766 Knollwood Dr
- 7137 Enterprise Dr
- 7047 Mountain Meadow Ln
- 7024 Bright Springs Ct
- 4826 Castle Rock Ct
- 7211 Mission Hills Dr
- 4844 Treetrunk Ave
- 7012 Bright Springs Ct
- 7094 Fenway Ave Unit 4
- 7061 Bright Springs Ct
- 7068 Bright Springs Ct
- 7296 Mission Hills Dr
- 6976 Emerald Springs Ln
- 6974 Emerald Springs Ln
- 7132 Mission Hills Dr
- 7157 Mission Hills Dr
- 7045 Grasswood Dr
- 7139 Mission Hills Dr
- 6902 Emerald Springs Ln
- 7131 Mission Hills Dr
- 7126 Southpark Ct
- 7146 Southpark Ct
- 7137 Limestone Rd
- 7147 Limestone Rd
- 7127 Limestone Rd
- 7156 Southpark Ct
- 7116 Southpark Ct
- 7137 Southpark Ct
- 7157 Limestone Rd Unit 6
- 7127 Southpark Ct
- 7117 Limestone Rd
- 7147 Southpark Ct
- 7166 Southpark Ct
- 7157 Southpark Ct
- 7117 Southpark Ct
- 7167 Limestone Rd
- 7167 Southpark Ct
- 7136 Enterprise Dr
- 7126 Enterprise Dr
- 7146 Enterprise Dr