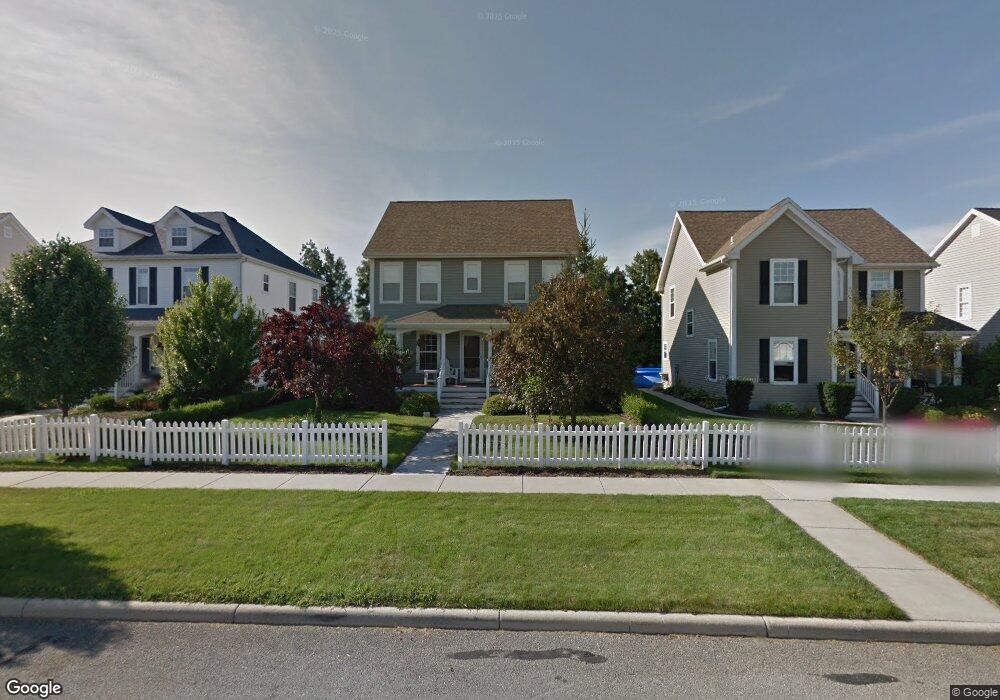
7139 Elli Harbour Ln Maumee, OH 43537
Estimated Value: $312,000 - $346,000
3
Beds
4
Baths
1,658
Sq Ft
$201/Sq Ft
Est. Value
About This Home
This home is located at 7139 Elli Harbour Ln, Maumee, OH 43537 and is currently estimated at $332,812, approximately $200 per square foot. 7139 Elli Harbour Ln is a home located in Lucas County with nearby schools including Anthony Wayne High School, Ohio Digital Learning School, and St Joseph Catholic School.
Ownership History
Date
Name
Owned For
Owner Type
Purchase Details
Closed on
Aug 27, 2020
Sold by
Sandretto Matthew J and Sandretto Jordan T
Bought by
Assally Wendy
Current Estimated Value
Home Financials for this Owner
Home Financials are based on the most recent Mortgage that was taken out on this home.
Original Mortgage
$228,000
Outstanding Balance
$202,335
Interest Rate
2.9%
Mortgage Type
New Conventional
Estimated Equity
$130,477
Purchase Details
Closed on
Jun 16, 2008
Sold by
Smith Wade R and Smith Holly L
Bought by
Sandretto Matthew J and Yoder Jordan T
Home Financials for this Owner
Home Financials are based on the most recent Mortgage that was taken out on this home.
Original Mortgage
$160,000
Interest Rate
6.04%
Mortgage Type
Purchase Money Mortgage
Purchase Details
Closed on
Dec 4, 2002
Sold by
Inc, Trustee Louisville Title Agency For Nw O
Bought by
Smith Wade R and Huebner Holly L
Create a Home Valuation Report for This Property
The Home Valuation Report is an in-depth analysis detailing your home's value as well as a comparison with similar homes in the area
Home Values in the Area
Average Home Value in this Area
Purchase History
| Date | Buyer | Sale Price | Title Company |
|---|---|---|---|
| Assally Wendy | $240,000 | None Available | |
| Sandretto Matthew J | $200,000 | Louisville Title Agency For | |
| Smith Wade R | $34,400 | Louisville Title Agency For |
Source: Public Records
Mortgage History
| Date | Status | Borrower | Loan Amount |
|---|---|---|---|
| Open | Assally Wendy | $228,000 | |
| Previous Owner | Sandretto Matthew J | $160,000 |
Source: Public Records
Tax History Compared to Growth
Tax History
| Year | Tax Paid | Tax Assessment Tax Assessment Total Assessment is a certain percentage of the fair market value that is determined by local assessors to be the total taxable value of land and additions on the property. | Land | Improvement |
|---|---|---|---|---|
| 2024 | $2,565 | $99,120 | $16,695 | $82,425 |
| 2023 | $4,883 | $84,700 | $11,410 | $73,290 |
| 2022 | $4,905 | $84,700 | $11,410 | $73,290 |
| 2021 | $4,800 | $84,700 | $11,410 | $73,290 |
| 2020 | $4,781 | $73,990 | $9,555 | $64,435 |
| 2019 | $4,649 | $73,990 | $9,555 | $64,435 |
| 2018 | $4,628 | $73,990 | $9,555 | $64,435 |
| 2017 | $4,161 | $62,720 | $12,705 | $50,015 |
| 2016 | $4,122 | $179,200 | $36,300 | $142,900 |
| 2015 | $3,952 | $179,200 | $36,300 | $142,900 |
| 2014 | $3,857 | $60,870 | $12,320 | $48,550 |
| 2013 | $3,857 | $60,870 | $12,320 | $48,550 |
Source: Public Records
Map
Nearby Homes
- 4541 Harbour Creek Ct
- 6948 Longwater Dr
- 4339 Sage St
- 4351 Sage St
- 4332 Sage St
- 4402 Sage St
- 7250 Violet Ln
- 6740 Monclova Rd
- 7342 Harbour Light Ct
- 4455 Post Office Cir
- 7231 Rolling Meadow Ln
- 4369 Post Office Cir
- 4352 Post Office Cir
- 4346 Post Office Cir
- 4340 Post Office Cir
- 4731 Cabriolet Ln
- 4334 Post Office Cir
- 4321 Post Office Cir
- 4335 Crystal Ridge Dr E
- 4228 Crystal Ridge Dr E
- 7143 Elli Harbour Ln
- 7135 Elli Harbour Ln
- 7147 Elli Harbour Ln
- 7131 Elli Harbour Ln
- 7127 Elli Harbour Ln
- 7151 Elli Harbour Ln
- lot556 Waterside Plat 21
- 7136 Elli Harbour Ln
- 7140 Elli Harbour Ln
- 7123 Elli Harbour Ln
- 7132 Elli Harbour Ln
- 7210 Elli Harbour Ln
- 7155 Elli Harbour Ln
- 7128 Elli Harbour Ln
- 7119 Elli Harbour Ln
- 7216 Elli Harbour Ln
- 7201 Elli Harbour Ln
- 4538 Cambay Ct
- 4538 Cam Bay Ct
- 7115 Elli Harbour Ln