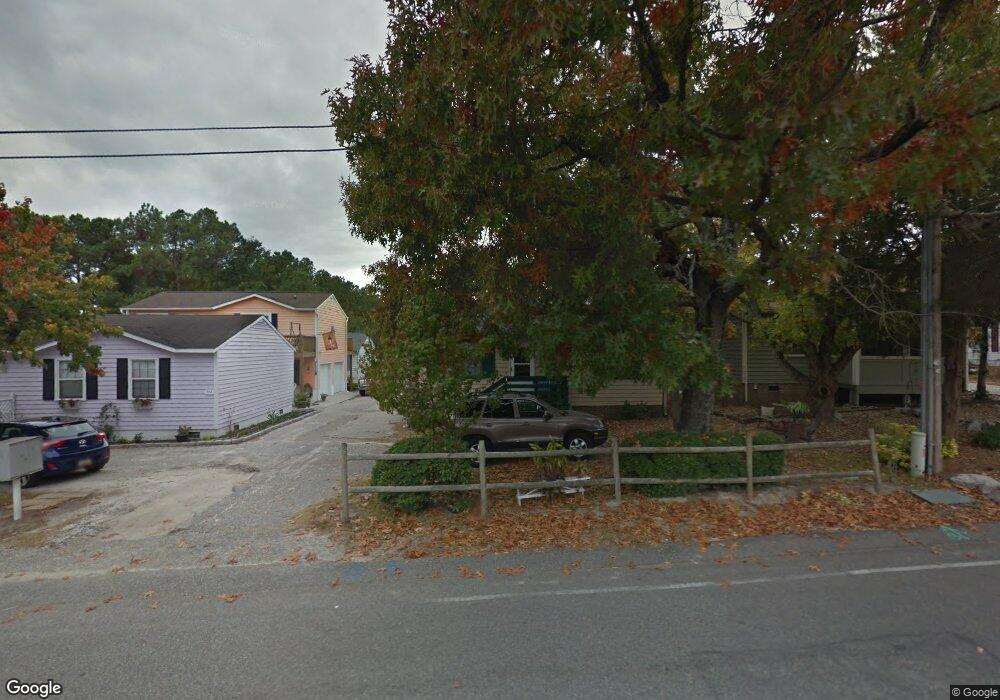
713B 3rd Ave S North Myrtle Beach, SC 29582
Ocean Drive NeighborhoodEstimated Value: $297,000 - $375,000
2
Beds
2
Baths
858
Sq Ft
$387/Sq Ft
Est. Value
About This Home
This home is located at 713B 3rd Ave S, North Myrtle Beach, SC 29582 and is currently estimated at $331,695, approximately $386 per square foot. 713B 3rd Ave S is a home located in Horry County with nearby schools including Ocean Drive Elementary School, North Myrtle Beach Middle School, and North Myrtle Beach High School.
Ownership History
Date
Name
Owned For
Owner Type
Purchase Details
Closed on
Aug 12, 2013
Sold by
Wheby Nora Cecelia
Bought by
Arnold Joshua L
Current Estimated Value
Purchase Details
Closed on
Jan 20, 2011
Sold by
Wheby Nora Cecelia
Bought by
Arnold Joshua L
Purchase Details
Closed on
Aug 25, 2008
Sold by
Sones Christopher R
Bought by
Wheby Nora Cecelia
Purchase Details
Closed on
Feb 11, 2005
Sold by
Negron Myra I Burstein
Bought by
Sones Christopher R
Home Financials for this Owner
Home Financials are based on the most recent Mortgage that was taken out on this home.
Original Mortgage
$66,000
Interest Rate
10.19%
Mortgage Type
Purchase Money Mortgage
Purchase Details
Closed on
May 28, 1999
Sold by
Rowe Gerald W and Rowe Jane Mary
Bought by
Negron Myra I Burstein
Home Financials for this Owner
Home Financials are based on the most recent Mortgage that was taken out on this home.
Original Mortgage
$63,860
Interest Rate
7.75%
Mortgage Type
Assumption
Create a Home Valuation Report for This Property
The Home Valuation Report is an in-depth analysis detailing your home's value as well as a comparison with similar homes in the area
Home Values in the Area
Average Home Value in this Area
Purchase History
| Date | Buyer | Sale Price | Title Company |
|---|---|---|---|
| Arnold Joshua L | -- | -- | |
| Arnold Joshua L | -- | -- | |
| Wheby Nora Cecelia | $115,000 | -- | |
| Sones Christopher R | $82,500 | -- | |
| Negron Myra I Burstein | $62,000 | -- |
Source: Public Records
Mortgage History
| Date | Status | Borrower | Loan Amount |
|---|---|---|---|
| Previous Owner | Sones Christopher R | $66,000 | |
| Previous Owner | Negron Myra I Burstein | $63,860 |
Source: Public Records
Tax History Compared to Growth
Tax History
| Year | Tax Paid | Tax Assessment Tax Assessment Total Assessment is a certain percentage of the fair market value that is determined by local assessors to be the total taxable value of land and additions on the property. | Land | Improvement |
|---|---|---|---|---|
| 2024 | $629 | $19,387 | $14,400 | $4,987 |
| 2023 | $629 | $5,103 | $2,732 | $2,371 |
| 2021 | $552 | $8,408 | $4,838 | $3,570 |
| 2020 | $539 | $8,408 | $4,838 | $3,570 |
| 2019 | $499 | $8,408 | $4,838 | $3,570 |
| 2018 | $469 | $6,656 | $3,314 | $3,342 |
| 2017 | $460 | $6,656 | $3,314 | $3,342 |
| 2016 | -- | $6,656 | $3,314 | $3,342 |
| 2015 | $452 | $6,656 | $3,314 | $3,342 |
| 2014 | $420 | $6,656 | $3,314 | $3,342 |
Source: Public Records
Map
Nearby Homes
- 618 3rd Ave S Unit 4B
- 707 1st Ave S Unit 36A
- 613 2nd Ave S Unit 21D
- 703 3rd Ave S
- 609B 3rd Ave S
- 611 2nd Ave S Unit 16 E
- 611 2nd Ave S Unit 18-C
- 618 5th Ave S
- 512 2nd Ave S
- 528 5th Ave S
- 94 Cedar Ave
- 606 7th Ave S Unit F
- 522 6th Ave S
- 100 Ye Olde Kings Hwy Unit E
- 508 5th Ave S
- 607 Rosemary Ln
- 611 Surfsong Way Unit B6-3
- 623 Rosemary Ln
- 620 Wave Rider Ln Unit B10-1
- 919 Baron Ln
- 711 3rd Ave S
- 715B 3rd Ave S
- 711C 3rd Ave S
- 715A 3rd Ave S
- 711B 3rd Ave S
- 709A 3rd Ave S
- 709B 3rd Ave S Unit Ocean Drive
- 709B 3rd Ave S
- 717A 3rd Ave S
- 717B 3rd Ave S
- 105 Barnwell St Unit 35 D
- 105 Barnwell St Unit SEA GARDEN BLDG 29,
- 105 Barnwell St Unit 29-D SEA GARDEN
- 105 Barnwell St Unit Sea Gardens 1B
- 105 Barnwell St Unit 1D
- 105 Barnwell St
- 105 Barnwell St Unit Sea Garden
- 105 Barnwell St Unit 2D
- 105 Barnwell St Unit 2C
- 105 Barnwell St Unit 2B