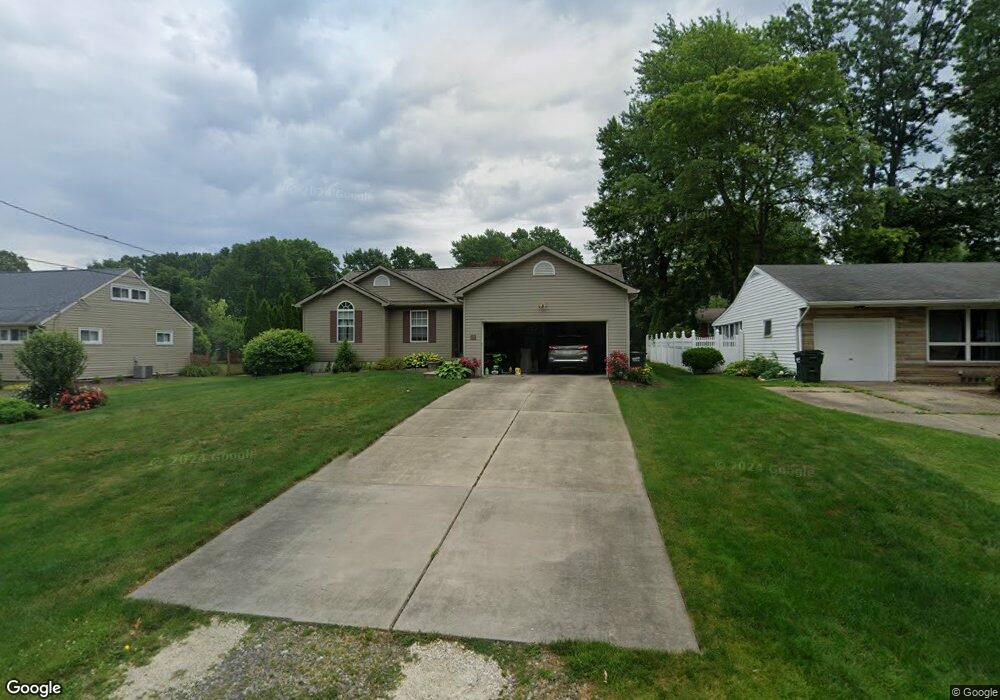
714 Charldon Ave SW Massillon, OH 44646
Estimated Value: $237,000 - $250,000
3
Beds
2
Baths
1,266
Sq Ft
$191/Sq Ft
Est. Value
About This Home
This home is located at 714 Charldon Ave SW, Massillon, OH 44646 and is currently estimated at $242,147, approximately $191 per square foot. 714 Charldon Ave SW is a home located in Stark County with nearby schools including Pfeiffer Intermediate School, Edison Middle School, and Perry High School.
Ownership History
Date
Name
Owned For
Owner Type
Purchase Details
Closed on
Jun 14, 2005
Sold by
Braun Bryan and Bissell Natalie
Bought by
Tully Joseph W
Current Estimated Value
Home Financials for this Owner
Home Financials are based on the most recent Mortgage that was taken out on this home.
Original Mortgage
$104,000
Outstanding Balance
$53,383
Interest Rate
5.5%
Mortgage Type
Fannie Mae Freddie Mac
Estimated Equity
$188,764
Purchase Details
Closed on
Jan 4, 2002
Sold by
Schalmo Builders Inc
Bought by
Braun Bryan and Bissell Natalie
Home Financials for this Owner
Home Financials are based on the most recent Mortgage that was taken out on this home.
Original Mortgage
$124,939
Interest Rate
7.26%
Mortgage Type
FHA
Purchase Details
Closed on
Nov 29, 2000
Sold by
Suarez Mary Jane
Bought by
Schalmo Builders Inc
Create a Home Valuation Report for This Property
The Home Valuation Report is an in-depth analysis detailing your home's value as well as a comparison with similar homes in the area
Home Values in the Area
Average Home Value in this Area
Purchase History
| Date | Buyer | Sale Price | Title Company |
|---|---|---|---|
| Tully Joseph W | $130,000 | Grimsley Title Agency | |
| Braun Bryan | $126,900 | Americas Choice Title Agency | |
| Schalmo Builders Inc | $27,500 | -- |
Source: Public Records
Mortgage History
| Date | Status | Borrower | Loan Amount |
|---|---|---|---|
| Open | Tully Joseph W | $104,000 | |
| Previous Owner | Braun Bryan | $124,939 | |
| Closed | Tully Joseph W | $26,000 |
Source: Public Records
Tax History Compared to Growth
Tax History
| Year | Tax Paid | Tax Assessment Tax Assessment Total Assessment is a certain percentage of the fair market value that is determined by local assessors to be the total taxable value of land and additions on the property. | Land | Improvement |
|---|---|---|---|---|
| 2025 | -- | $76,480 | $11,410 | $65,070 |
| 2024 | -- | $76,480 | $11,410 | $65,070 |
| 2023 | $2,835 | $56,530 | $10,050 | $46,480 |
| 2022 | $2,849 | $56,530 | $10,050 | $46,480 |
| 2021 | $3,034 | $56,530 | $10,050 | $46,480 |
| 2020 | $2,662 | $47,570 | $8,440 | $39,130 |
| 2019 | $2,401 | $47,570 | $8,440 | $39,130 |
| 2018 | $2,372 | $47,570 | $8,440 | $39,130 |
| 2017 | $2,364 | $43,930 | $6,550 | $37,380 |
| 2016 | $2,377 | $43,930 | $6,550 | $37,380 |
| 2015 | $2,398 | $43,930 | $6,550 | $37,380 |
| 2014 | $425 | $43,750 | $6,510 | $37,240 |
| 2013 | $1,155 | $43,750 | $6,510 | $37,240 |
Source: Public Records
Map
Nearby Homes
- 2950 Southway St SW
- 232 Proudley Ave SW
- 0 Clark St SW Unit 5126336
- 0 Newport Ave NW Unit 5143464
- 226 Austin Ave NW
- 212 Lennox Ave NW
- 174 26th St SE
- 3626 Hazelbrook St SW
- 141 Ingall Ave NW
- 229 25th St SE
- 420 Snively Ave NW
- 302 Jackson Ave NW
- 3412 Bailey St NW
- 138 Wrexham Ave SW
- 2335 Southway St SW
- 156 24th St SE
- 3834 Clark St SW
- 2221 Oak Ave SE
- 518 Jackson Ave NW
- 2201 Cambridge Ave SE
- 720 Charldon Ave SW
- 710 Charldon Ave SW
- 715 Edgewood Ave SW
- 721 Edgewood Ave SW
- 711 Edgewood Ave SW
- 724 Charldon Ave SW
- 702 Charldon Ave SW
- 717 Charldon Ave SW
- 725 Edgewood Ave SW
- 711 Charldon Ave SW
- 3157 Marta St SW
- 707 Charldon Ave SW
- 3165 Marta St SW
- 725 Charldon Ave SW
- 731 Edgewood Ave SW
- 3135 Marta St SW
- 736 Charldon Ave SW
- 714 Edgewood Ave SW
- 720 Edgewood Ave SW
- 731 Charldon Ave SW