Estimated Value: $149,202 - $194,000
--
Bed
--
Bath
1,010
Sq Ft
$174/Sq Ft
Est. Value
About This Home
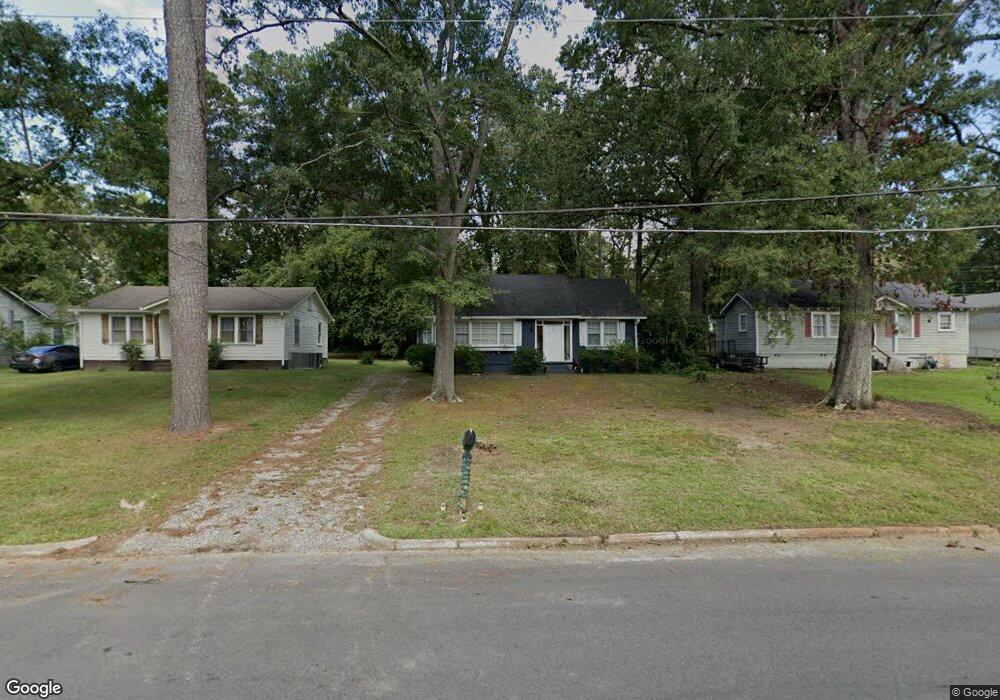
This home is located at 714 Charlton St NW, Rome, GA 30165 and is currently estimated at $175,551, approximately $173 per square foot. 714 Charlton St NW is a home located in Floyd County with nearby schools including Rome High School.
Ownership History
Date
Name
Owned For
Owner Type
Purchase Details
Closed on
Feb 15, 2002
Sold by
Boss Don
Bought by
Boss Don P and Boss Michelle L
Current Estimated Value
Purchase Details
Closed on
Jul 25, 1995
Sold by
Boss Donald Paul and Michelle Lavance Mccu
Bought by
Boss Don
Purchase Details
Closed on
Nov 5, 1988
Sold by
Mathis David and Mathis William E
Bought by
Boss Donald Paul and Michelle Lavance
Purchase Details
Closed on
Jun 28, 1985
Sold by
Alexander & Hansard Inc
Bought by
Mathis David and Mathis William E
Purchase Details
Closed on
Sep 10, 1984
Sold by
Moore Pamela S
Bought by
Alexander & Hansard Inc
Purchase Details
Closed on
Jul 19, 1980
Sold by
Craighead Joan
Bought by
Moore Pamela S
Purchase Details
Closed on
Jul 10, 1974
Sold by
Baker A J
Bought by
Craighead Joan
Purchase Details
Closed on
May 28, 1969
Sold by
Casey H D
Bought by
Baker A J
Purchase Details
Closed on
Jan 1, 1901
Bought by
Casey H D
Create a Home Valuation Report for This Property
The Home Valuation Report is an in-depth analysis detailing your home's value as well as a comparison with similar homes in the area
Home Values in the Area
Average Home Value in this Area
Purchase History
| Date | Buyer | Sale Price | Title Company |
|---|---|---|---|
| Boss Don P | -- | -- | |
| Boss Don | -- | -- | |
| Boss Donald Paul | $33,400 | -- | |
| Mathis David | $28,100 | -- | |
| Alexander & Hansard Inc | $28,200 | -- | |
| Moore Pamela S | $25,000 | -- | |
| Craighead Joan | $16,000 | -- | |
| Baker A J | $10,700 | -- | |
| Casey H D | -- | -- |
Source: Public Records
Tax History Compared to Growth
Tax History
| Year | Tax Paid | Tax Assessment Tax Assessment Total Assessment is a certain percentage of the fair market value that is determined by local assessors to be the total taxable value of land and additions on the property. | Land | Improvement |
|---|---|---|---|---|
| 2024 | $2,461 | $64,062 | $8,463 | $55,599 |
| 2023 | $2,269 | $55,291 | $7,644 | $47,647 |
| 2022 | $1,671 | $45,801 | $6,279 | $39,522 |
| 2021 | $1,415 | $38,137 | $6,279 | $31,858 |
| 2020 | $1,312 | $35,077 | $4,778 | $30,299 |
| 2019 | $1,138 | $30,748 | $4,778 | $25,970 |
| 2018 | $1,083 | $29,265 | $4,778 | $24,487 |
| 2017 | $1,055 | $28,484 | $4,778 | $23,706 |
| 2016 | $1,040 | $28,000 | $4,760 | $23,240 |
| 2015 | $1,017 | $28,320 | $4,760 | $23,560 |
| 2014 | $1,017 | $29,000 | $4,760 | $24,240 |
Source: Public Records
Map
Nearby Homes
- 614 Briarwood Cir NW
- 808 Charlton St NW
- 208 Dodd St NW
- 124 Sheridan Dr NW
- 204 Oakwood St NW
- 7 Raymond Ave NW
- 23 Sweetspire Dr NW
- 21 Sweetspire Dr NW
- 15 Silverbell Ln
- 105 Robin St NW
- 0 Unbridled Rd Unit 22 23074684
- 214 N Elm St NW
- 8 S Hughes St SW
- 209 Sherwood Rd SW
- 9 Shorter Cir SW
- 4 Colonial Dr NW
- 3 Berckman Ln SW
- 19 Berckman Ln SW
- 712 Charlton St NW
- 716 Charlton St NW
- 605 Briarwood Cir NW
- 718 Charlton St NW
- 710 Charlton St NW
- 607 Briarwood Cir NW
- 0 Briarwood Cir NW Unit 7364598
- 0 Briarwood Cir NW Unit 8689868
- 0 Briarwood Cir NW Unit 8551890
- 0 Briarwood Cir NW Unit 8317321
- 0 Briarwood Cir NW Unit 8153200
- 0 Briarwood Cir NW Unit 7593301
- 0 Briarwood Cir NW Unit 7573591
- 0 Briarwood Cir NW Unit 7506856
- 0 Briarwood Cir NW Unit 8173118
- 0 Briarwood Cir NW Unit 8762532
- 0 Briarwood Cir NW Unit 8883330
- 0 Briarwood Cir NW Unit 2973717
- 0 Briarwood Cir NW Unit 3187839
- 0 Briarwood Cir NW Unit 7014611