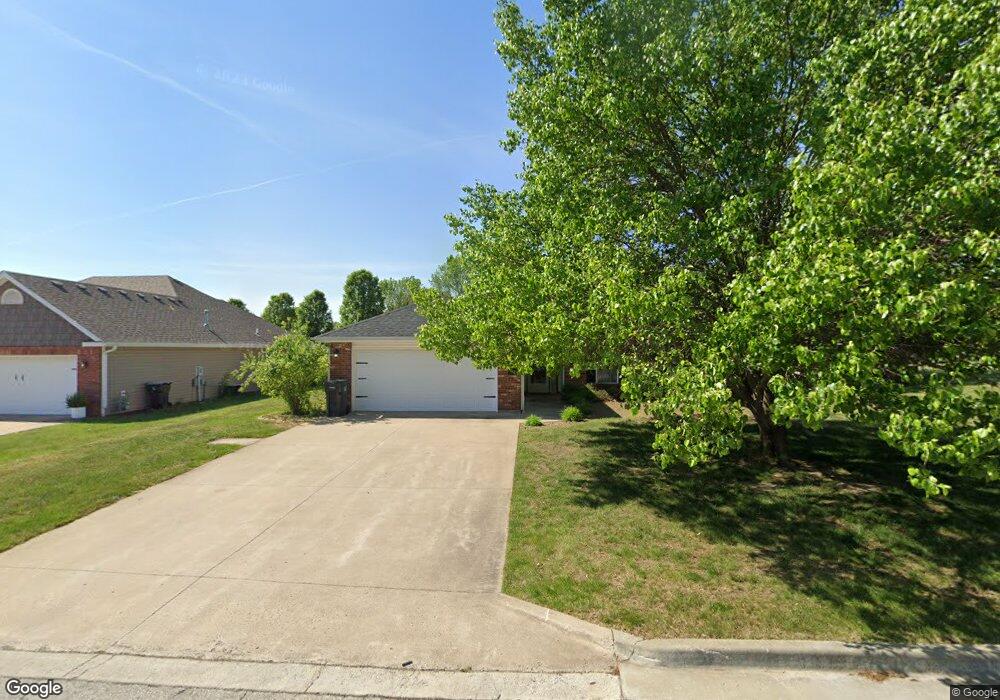
714 Covey Ct Moberly, MO 65270
Estimated Value: $250,000 - $283,000
About This Home
This home is located at 714 Covey Ct, Moberly, MO 65270 and is currently estimated at $268,676, approximately $179 per square foot. 714 Covey Ct is a home located in Randolph County with nearby schools including Moberly Senior High School, Maranatha Seventh-day Adventist School, and Terrill Road Christian Academy.
Ownership History
We collect this data history from publicly available records. To have your information removed, we recommend requesting removal directly through your county’s website.
Purchase Details
Home Financials for this Owner
Home Financials are based on the most recent Mortgage that was taken out on this home.Purchase Details
Purchase Details
Home Financials for this Owner
Home Financials are based on the most recent Mortgage that was taken out on this home.Home Values in the Area
Average Home Value in this Area
Purchase History
We collect this data history from publicly available records. To have your information removed, we recommend requesting removal directly through your county’s website.
| Date | Buyer | Sale Price | Title Company |
|---|---|---|---|
| -- | None Listed On Document | ||
| -- | None Listed On Document | ||
| -- | None Available | ||
| -- | -- |
Mortgage History
We collect this data history from publicly available records. To have your information removed, we recommend requesting removal directly through your county’s website.
| Date | Status | Borrower | Loan Amount |
|---|---|---|---|
| Open | $203,500 | ||
| Closed | $203,500 | ||
| Previous Owner | $110,400 |
Tax History
We collect this data history from publicly available records. To have your information removed, we recommend requesting removal directly through your county’s website.
| Year | Tax Paid | Tax Assessment Tax Assessment Total Assessment is a certain percentage of the fair market value that is determined by local assessors to be the total taxable value of land and additions on the property. | Land | Improvement |
|---|---|---|---|---|
| 2025 | $2,458 | $33,090 | $5,570 | $27,520 |
| 2024 | $22 | $30,330 | $4,845 | $25,485 |
| 2023 | $2,242 | $30,330 | $4,845 | $25,485 |
| 2022 | $2,078 | $28,859 | $4,845 | $24,014 |
| 2020 | $2,079 | $28,890 | $4,846 | $24,044 |
| 2019 | $2,075 | $28,890 | $4,846 | $24,044 |
| 2018 | $2,078 | $29,030 | $4,846 | $24,184 |
| 2017 | $2,074 | $29,030 | $0 | $0 |
| 2016 | $1,961 | $27,600 | $0 | $0 |
| 2014 | -- | $25,760 | $0 | $0 |
| 2013 | -- | $25,760 | $0 | $0 |
| 2012 | -- | $25,590 | $0 | $0 |
Map
- 1150 S Morley St
- 900 Fox Run
- 1001 Bradford Cir
- 1215 Shepherds Dr
- 610 Garfield Ave
- 606 Promenade St
- 1000 S Williams St
- 505 Mckinley Ave
- 757 Meadowbrook Cir
- 515 Garfield Ave
- 417 Garfield Ave
- 501 W Longview St
- 437 Tara Park
- 517 S Clark St
- 522A S Williams St
- 1807 Ronda Ct
- 1900 Eastbrook Cir
- 216 Lotter St
- 18 Urbandale
- 0 10 Acres Cedar Ridge Unit 417498
- 1218 Quail Haven
- 1218 Quail Haven Dr
- 1206 Quail Haven Dr
- 705 Covey Ct
- 715 Covey Ct
- 1205 Woodridge Ln
- 723 Covey Ct
- 1219 Quail Haven Dr
- 1215 Quail Haven
- 1225 Quail Haven Dr
- 0 Lot 33 Quail Haven
- 1308 Quail Haven
- 1203 Quail Haven Dr
- 1203 Quail Haven
- 1207 Quail Haven Dr
- 1308 Quail Haven Dr
- 1215 Woodridge Ln
- 1303 Quail Haven
- 1204 Woodridge Ln
- 1211 Quail Haven Dr
Ask me questions while you tour the home.