Estimated Value: $83,000 - $106,000
2
Beds
1
Bath
1,217
Sq Ft
$80/Sq Ft
Est. Value
About This Home
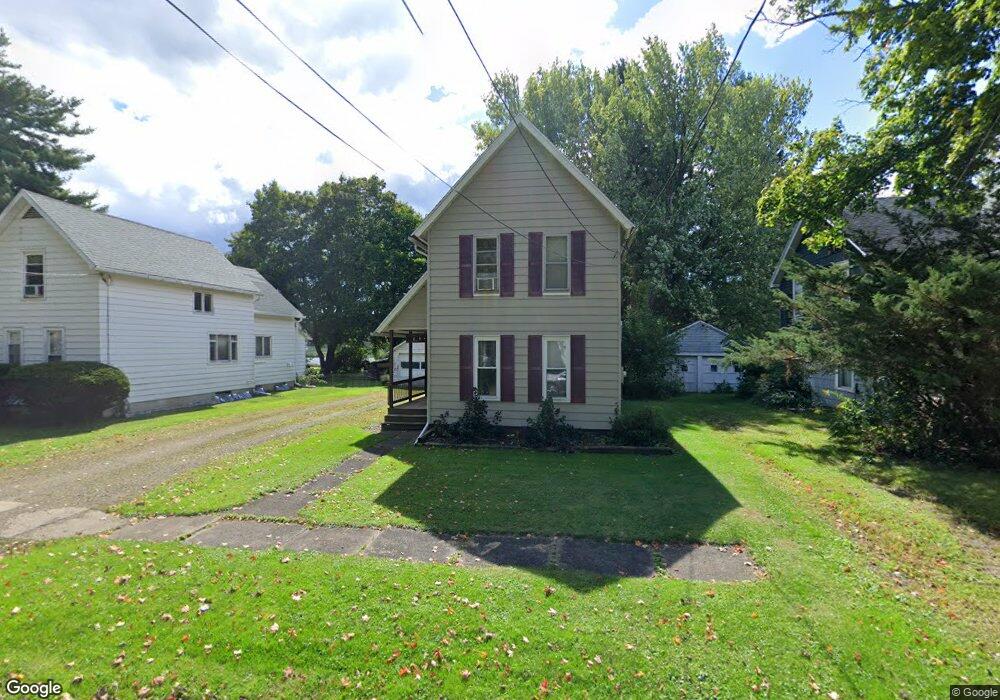
This home is located at 714 Hoop St, Olean, NY 14760 and is currently estimated at $97,464, approximately $80 per square foot. 714 Hoop St is a home located in Cattaraugus County with nearby schools including Olean Intermediate-Middle School, Olean Senior High School, and New Life Christian School.
Ownership History
Date
Name
Owned For
Owner Type
Purchase Details
Closed on
Sep 10, 2018
Sold by
Dick David J
Bought by
Belvees Nicholas J
Current Estimated Value
Home Financials for this Owner
Home Financials are based on the most recent Mortgage that was taken out on this home.
Original Mortgage
$44,000
Outstanding Balance
$31,891
Interest Rate
4.5%
Mortgage Type
Unknown
Estimated Equity
$65,573
Purchase Details
Closed on
Sep 4, 2018
Sold by
Dick David J
Bought by
Belvees Nicholas J
Home Financials for this Owner
Home Financials are based on the most recent Mortgage that was taken out on this home.
Original Mortgage
$44,000
Outstanding Balance
$31,891
Interest Rate
4.5%
Mortgage Type
Unknown
Estimated Equity
$65,573
Purchase Details
Closed on
Feb 21, 2008
Sold by
Wiley-Dick Tammy
Bought by
Dick David
Purchase Details
Closed on
Dec 31, 2002
Sold by
Aaron Benson R
Bought by
Wiley Tammy L
Create a Home Valuation Report for This Property
The Home Valuation Report is an in-depth analysis detailing your home's value as well as a comparison with similar homes in the area
Home Values in the Area
Average Home Value in this Area
Purchase History
| Date | Buyer | Sale Price | Title Company |
|---|---|---|---|
| Belvees Nicholas J | $55,000 | None Available | |
| Belvees Nicholas J | $55,000 | None Available | |
| Belvees Nicholas J | -- | -- | |
| Dick David | -- | -- | |
| Wiley Tammy L | $29,000 | Gerardus A. Backhaus |
Source: Public Records
Mortgage History
| Date | Status | Borrower | Loan Amount |
|---|---|---|---|
| Open | Belvees Nicholas J | $44,000 | |
| Closed | Belvees Nicholas J | $44,000 |
Source: Public Records
Tax History
| Year | Tax Paid | Tax Assessment Tax Assessment Total Assessment is a certain percentage of the fair market value that is determined by local assessors to be the total taxable value of land and additions on the property. | Land | Improvement |
|---|---|---|---|---|
| 2025 | $3,351 | $53,000 | $5,200 | $47,800 |
| 2024 | $3,351 | $53,000 | $5,200 | $47,800 |
| 2023 | $1,995 | $53,000 | $5,200 | $47,800 |
| 2022 | $2,024 | $53,000 | $5,200 | $47,800 |
| 2021 | $2,083 | $53,000 | $5,200 | $47,800 |
| 2020 | $2,097 | $53,000 | $5,200 | $47,800 |
| 2019 | $796 | $53,000 | $5,200 | $47,800 |
| 2018 | $2,218 | $53,000 | $5,200 | $47,800 |
| 2017 | $1,472 | $53,000 | $5,200 | $47,800 |
| 2016 | $1,431 | $53,000 | $5,200 | $47,800 |
| 2015 | -- | $53,000 | $5,200 | $47,800 |
| 2014 | -- | $53,000 | $5,200 | $47,800 |
Source: Public Records
Map
Nearby Homes
- 754 Garden Ave
- 802 Garden Ave
- 734 Bishop St
- 184 Grossman Ave
- 1005 Billington St
- 330 Laurel Ave
- 109 Bradley Dr
- 735 E Highland Ave Unit 39
- 120 E Green St
- 2 Edwards Ct
- 118 E Green St
- 1 Edwards Ct
- 116 E Green St
- 114 E Green St
- 1013-1025 Brook St
- 650 Queen St
- 611 Gulf St
- 483 Vermont St
- 124 W Green St
- 422 York St
Your Personal Tour Guide
Ask me questions while you tour the home.