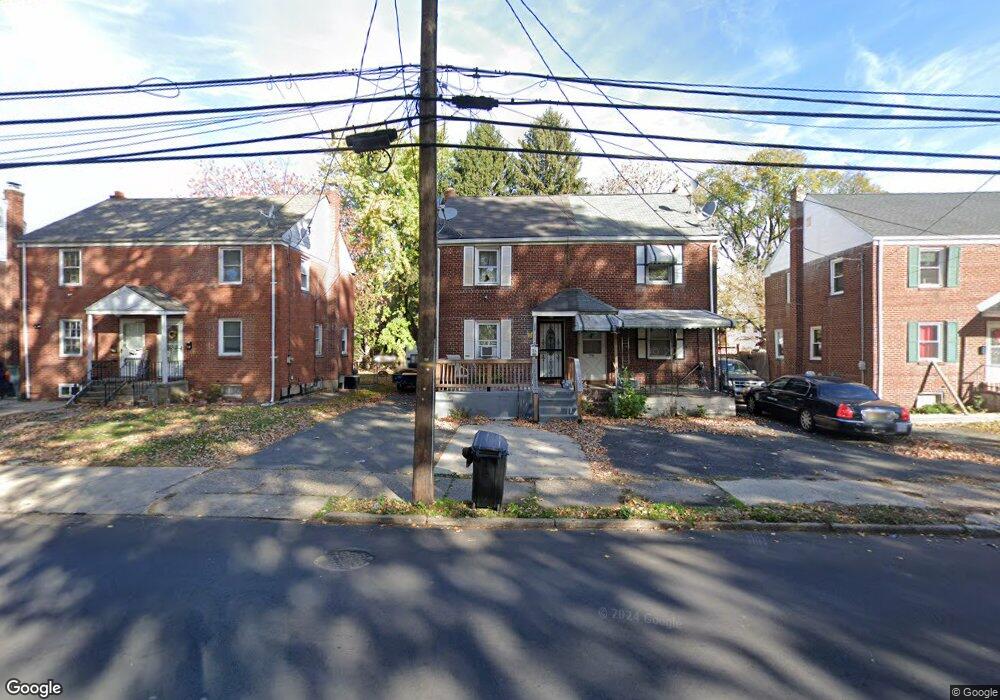
714 Lalor St Trenton, NJ 08610
Franklin Park NeighborhoodEstimated Value: $143,000 - $192,000
--
Bed
--
Bath
832
Sq Ft
$199/Sq Ft
Est. Value
About This Home
This home is located at 714 Lalor St, Trenton, NJ 08610 and is currently estimated at $165,514, approximately $198 per square foot. 714 Lalor St is a home located in Mercer County with nearby schools including Franklin Elementary School, Dr. Crosby Copeland Elementary School, and Grace A Dunn Middle School.
Ownership History
Date
Name
Owned For
Owner Type
Purchase Details
Closed on
Feb 3, 2020
Sold by
Otero Lourdes and Nationstar Mortgage Llc
Bought by
Henry S Homes Llc
Current Estimated Value
Purchase Details
Closed on
May 4, 2007
Purchase Details
Closed on
Jun 21, 1994
Sold by
Salvatore Jean
Bought by
Malik Naeem and Rizwana Yasmin
Home Financials for this Owner
Home Financials are based on the most recent Mortgage that was taken out on this home.
Original Mortgage
$20,000
Interest Rate
8.55%
Create a Home Valuation Report for This Property
The Home Valuation Report is an in-depth analysis detailing your home's value as well as a comparison with similar homes in the area
Home Values in the Area
Average Home Value in this Area
Purchase History
| Date | Buyer | Sale Price | Title Company |
|---|---|---|---|
| Henry S Homes Llc | $61,000 | None Available | |
| -- | $115,000 | -- | |
| Malik Naeem | $31,000 | -- |
Source: Public Records
Mortgage History
| Date | Status | Borrower | Loan Amount |
|---|---|---|---|
| Previous Owner | Malik Naeem | $20,000 |
Source: Public Records
Tax History Compared to Growth
Tax History
| Year | Tax Paid | Tax Assessment Tax Assessment Total Assessment is a certain percentage of the fair market value that is determined by local assessors to be the total taxable value of land and additions on the property. | Land | Improvement |
|---|---|---|---|---|
| 2025 | $2,773 | $47,800 | $7,600 | $40,200 |
| 2024 | $2,661 | $47,800 | $7,600 | $40,200 |
| 2023 | $2,661 | $47,800 | $7,600 | $40,200 |
| 2022 | $2,609 | $47,800 | $7,600 | $40,200 |
| 2021 | $2,654 | $47,800 | $7,600 | $40,200 |
| 2020 | $2,646 | $47,800 | $7,600 | $40,200 |
| 2019 | $2,603 | $47,800 | $7,600 | $40,200 |
| 2018 | $2,492 | $47,800 | $7,600 | $40,200 |
| 2017 | $2,368 | $47,800 | $7,600 | $40,200 |
| 2016 | $3,273 | $56,900 | $16,000 | $40,900 |
| 2015 | $3,262 | $56,900 | $16,000 | $40,900 |
| 2014 | $3,247 | $56,900 | $16,000 | $40,900 |
Source: Public Records
Map
Nearby Homes