714 Oak St Unit 714C Winnetka, IL 60093
Estimated Value: $236,000 - $631,000
1
Bed
--
Bath
792
Sq Ft
$483/Sq Ft
Est. Value
About This Home
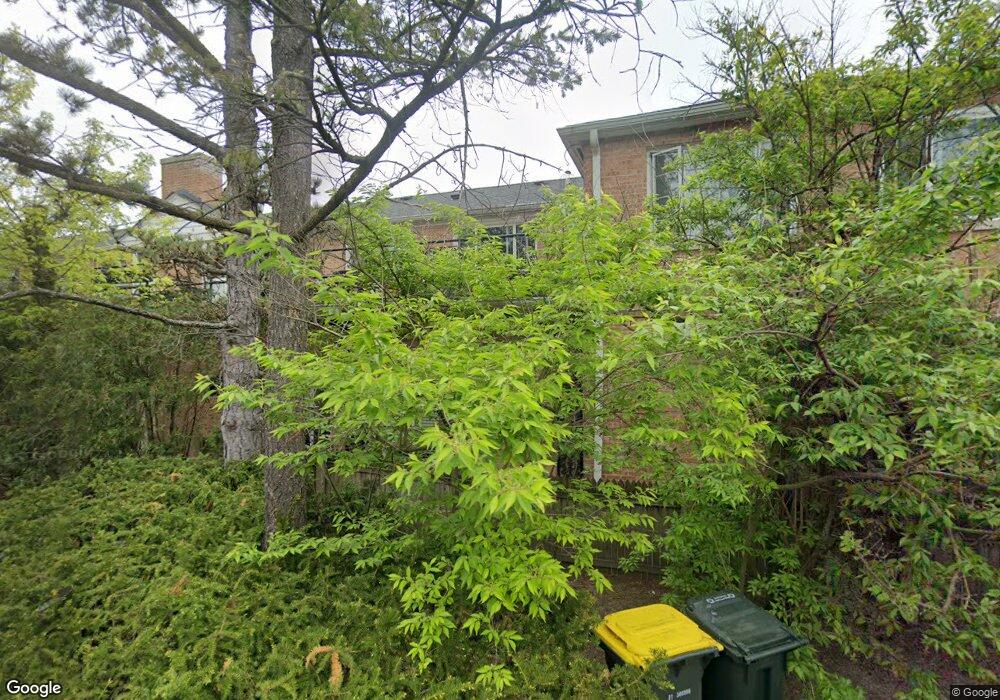
This home is located at 714 Oak St Unit 714C, Winnetka, IL 60093 and is currently estimated at $382,209, approximately $482 per square foot. 714 Oak St Unit 714C is a home located in Cook County with nearby schools including Greeley Elementary School, The Skokie School, and The Carleton W. Washburne School.
Ownership History
Date
Name
Owned For
Owner Type
Purchase Details
Closed on
May 29, 2008
Sold by
Moffat Everett H
Bought by
Lottich David
Current Estimated Value
Purchase Details
Closed on
Mar 29, 2004
Sold by
Moffat John D
Bought by
Moffat Everett H
Purchase Details
Closed on
Nov 29, 2003
Sold by
Thornton William L and Moffat Alexander E
Bought by
Moffat Everett H
Purchase Details
Closed on
Nov 11, 2003
Sold by
Thornton William L and Moffat Andrea J
Bought by
Moffat John D
Purchase Details
Closed on
Nov 6, 1996
Sold by
American National Bk & Tr Co Of Chicago
Bought by
Thornton William L and Alexander E Moffat Trust
Create a Home Valuation Report for This Property
The Home Valuation Report is an in-depth analysis detailing your home's value as well as a comparison with similar homes in the area
Home Values in the Area
Average Home Value in this Area
Purchase History
| Date | Buyer | Sale Price | Title Company |
|---|---|---|---|
| Lottich David | $125,000 | Chicago Title Insurance Co | |
| Moffat Everett H | -- | -- | |
| Moffat Everett H | -- | -- | |
| Moffat John D | -- | -- | |
| Thornton William L | $47,000 | -- |
Source: Public Records
Tax History
| Year | Tax Paid | Tax Assessment Tax Assessment Total Assessment is a certain percentage of the fair market value that is determined by local assessors to be the total taxable value of land and additions on the property. | Land | Improvement |
|---|---|---|---|---|
| 2025 | $3,943 | $26,190 | $1,586 | $24,604 |
| 2024 | $3,943 | $13,013 | $1,939 | $11,074 |
| 2023 | $4,583 | $17,010 | $1,939 | $15,071 |
| 2022 | $4,583 | $21,000 | $1,939 | $19,061 |
| 2021 | $5,144 | $19,820 | $1,321 | $18,499 |
| 2020 | $5,062 | $19,820 | $1,321 | $18,499 |
| 2019 | $5,777 | $24,775 | $1,321 | $23,454 |
| 2018 | $4,923 | $20,526 | $1,145 | $19,381 |
| 2017 | $4,771 | $20,526 | $1,145 | $19,381 |
| 2016 | $4,544 | $20,526 | $1,145 | $19,381 |
| 2015 | $3,075 | $12,500 | $954 | $11,546 |
| 2014 | $3,009 | $12,500 | $954 | $11,546 |
| 2013 | $2,870 | $12,500 | $954 | $11,546 |
Source: Public Records
Map
Nearby Homes
- 711 Oak St Unit 106
- 355 Linden St
- 607 Orchard Ln
- 916 Oak St
- 640 Winnetka Mews Unit 405
- 510 Provident Ave
- 455 Sheridan Rd
- 706 Foxdale Ave
- 1004 Elm St
- 334 Woodland Ave
- 4 Indian Hill Rd
- 567 Hill Terrace
- 312 Rosewood Ave
- 979 Vine St
- 1215 Spruce St
- 358 Winnetka Ave
- 270 Euclid Ave
- 165 Fuller Ln
- 303 Auburn Ave
- 43 Indian Hill Rd
- 714 Oak St Unit 714B
- 714 Oak St Unit 714D
- 714 Oak St Unit 714A
- 716 Oak St
- 740 Oak St Unit 740
- 742 Oak St Unit 742
- 738 Oak St Unit 738
- 744 Oak St Unit 744
- 734 Oak St Unit 734
- 732 Oak St Unit 732
- 728 Oak St Unit 728
- 726 Oak St Unit 726
- 724 Oak St Unit 724
- 711 Oak St Unit 208
- 711 Oak St Unit 206
- 711 Oak St Unit 109
- 711 Oak St
- 711 Oak St Unit 410
- 711 Oak St Unit 210
- 711 Oak St Unit 401
Your Personal Tour Guide
Ask me questions while you tour the home.