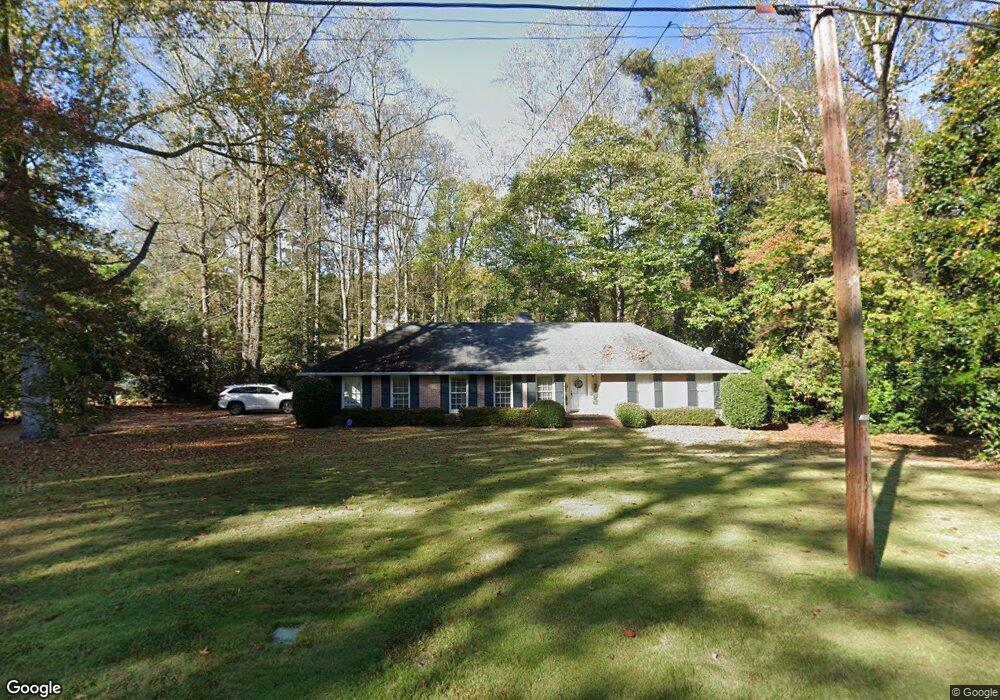
714 Ridgecrest Rd Lagrange, GA 30240
Estimated Value: $303,000 - $346,000
3
Beds
2
Baths
2,222
Sq Ft
$147/Sq Ft
Est. Value
About This Home
This home is located at 714 Ridgecrest Rd, Lagrange, GA 30240 and is currently estimated at $326,284, approximately $146 per square foot. 714 Ridgecrest Rd is a home located in Troup County with nearby schools including Hollis Hand Elementary School, Ethel W. Kight Elementary School, and Franklin Forest Elementary School.
Ownership History
Date
Name
Owned For
Owner Type
Purchase Details
Closed on
May 15, 2020
Sold by
Meyer Cameron
Bought by
Meyer Matthew P and Croft Ashlynn
Current Estimated Value
Home Financials for this Owner
Home Financials are based on the most recent Mortgage that was taken out on this home.
Original Mortgage
$189,000
Outstanding Balance
$166,376
Interest Rate
3.3%
Estimated Equity
$159,908
Purchase Details
Closed on
Mar 16, 2018
Sold by
Hutchinson Tommy
Bought by
Weyer Cameron
Home Financials for this Owner
Home Financials are based on the most recent Mortgage that was taken out on this home.
Original Mortgage
$170,329
Interest Rate
4.62%
Mortgage Type
FHA
Purchase Details
Closed on
Feb 26, 2015
Sold by
Lancaster John K
Bought by
Hutchinson Tommy
Purchase Details
Closed on
Feb 26, 2014
Sold by
Lancaster Dorothy S
Bought by
Lancaster Lynne Chapman
Purchase Details
Closed on
Jan 1, 1961
Sold by
Lamar Wadsworth
Bought by
Lancaster John K and Lancaster Dorothy
Create a Home Valuation Report for This Property
The Home Valuation Report is an in-depth analysis detailing your home's value as well as a comparison with similar homes in the area
Purchase History
| Date | Buyer | Sale Price | Title Company |
|---|---|---|---|
| Meyer Matthew P | $210,000 | -- | |
| Weyer Cameron | $186,000 | -- | |
| Hutchinson Tommy | $140,300 | -- | |
| Lancaster Lynne Chapman | -- | -- | |
| Lancaster John K | -- | -- |
Source: Public Records
Mortgage History
| Date | Status | Borrower | Loan Amount |
|---|---|---|---|
| Open | Meyer Matthew P | $189,000 | |
| Previous Owner | Weyer Cameron | $170,329 |
Source: Public Records
Tax History
| Year | Tax Paid | Tax Assessment Tax Assessment Total Assessment is a certain percentage of the fair market value that is determined by local assessors to be the total taxable value of land and additions on the property. | Land | Improvement |
|---|---|---|---|---|
| 2025 | $3,202 | $117,412 | $18,000 | $99,412 |
| 2024 | $2,463 | $90,292 | $18,000 | $72,292 |
| 2023 | $2,405 | $88,172 | $18,000 | $70,172 |
| 2022 | $2,345 | $84,012 | $18,000 | $66,012 |
| 2021 | $2,362 | $78,332 | $18,000 | $60,332 |
| 2020 | $2,363 | $78,332 | $18,000 | $60,332 |
| 2019 | $2,244 | $76,132 | $17,400 | $58,732 |
| 2018 | $2,212 | $73,332 | $17,400 | $55,932 |
| 2017 | $1,740 | $57,696 | $16,000 | $41,696 |
| 2016 | $1,693 | $56,120 | $15,743 | $40,377 |
| 2015 | $1,454 | $57,042 | $16,000 | $41,042 |
| 2014 | $1,420 | $49,064 | $17,414 | $31,650 |
| 2013 | -- | $55,656 | $17,414 | $38,243 |
Source: Public Records
Map
Nearby Homes
- 910 Piney Woods Dr
- 705 Piney Woods Dr
- 0 Hills and Dales Farm Rd
- 216 E Lane Cir
- 203 Waverly Way
- 120 Saynor Cir
- 598 Edmondson Ave
- 105 Saynor Cir
- 222 Beechwood Cir
- 724 Camellia Dr
- 0 N Lee St Unit 10550825
- 217 Jefferson St
- 106 Ewing St
- 732 Camellia Dr
- 119 College Ave
- 203 S Chilton Crescent
- 201 S Chilton Crescent
- 109 Thomas St
- 208 Boulevard
- 219 Banks St
- 714 Ridgecrest Rd Unit 53
- 718 Ridgecrest Rd
- 712 Ridgecrest Rd
- 715 Ridgecrest Rd
- 713 Ridgecrest Rd
- 722 Ridgecrest Rd
- 717 Ridgecrest Rd
- 916 Country Club Rd
- 706 Ridgecrest Rd
- 239 Westwood Dr
- 724 Ridgecrest Rd
- 235 Westwood Dr
- 701 Ridgecrest Rd
- 233 Westwood Dr
- 233 Westwood Dr Unit 20
- 601 Country Club Rd
- 725 Ridgecrest Rd
- 225 Westwood Dr
- 728 Ridgecrest Rd
Your Personal Tour Guide
Ask me questions while you tour the home.