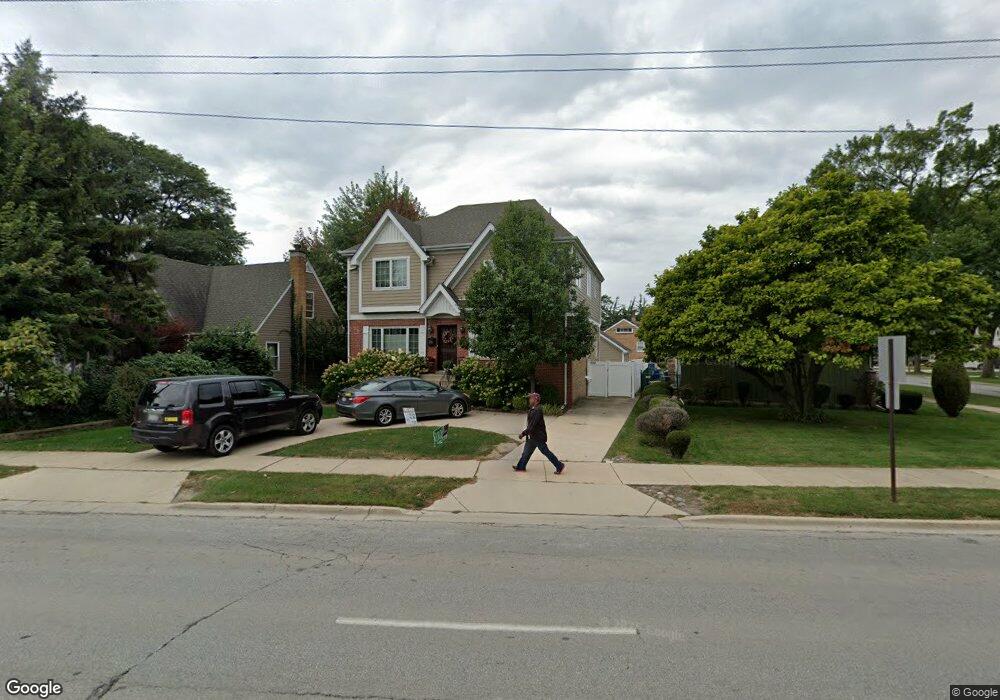
714 S York St Elmhurst, IL 60126
Estimated Value: $844,004 - $1,116,000
--
Bed
--
Bath
3,020
Sq Ft
$325/Sq Ft
Est. Value
About This Home
This home is located at 714 S York St, Elmhurst, IL 60126 and is currently estimated at $981,501, approximately $325 per square foot. 714 S York St is a home located in DuPage County with nearby schools including Lincoln Elementary School, Bryan Middle School, and York Community High School.
Ownership History
Date
Name
Owned For
Owner Type
Purchase Details
Closed on
Aug 6, 2002
Sold by
Marzano Cara A and Calcagno Cara A
Bought by
Marzano Joseph C and Marzano Cara A
Current Estimated Value
Home Financials for this Owner
Home Financials are based on the most recent Mortgage that was taken out on this home.
Original Mortgage
$172,000
Interest Rate
5.37%
Purchase Details
Closed on
May 28, 1999
Sold by
Calcagno Pasquale A and Calcagno Catherine A
Bought by
Calcagno Cara
Home Financials for this Owner
Home Financials are based on the most recent Mortgage that was taken out on this home.
Original Mortgage
$138,500
Interest Rate
6.94%
Create a Home Valuation Report for This Property
The Home Valuation Report is an in-depth analysis detailing your home's value as well as a comparison with similar homes in the area
Home Values in the Area
Average Home Value in this Area
Purchase History
| Date | Buyer | Sale Price | Title Company |
|---|---|---|---|
| Marzano Joseph C | -- | -- | |
| Calcagno Cara | $143,000 | -- |
Source: Public Records
Mortgage History
| Date | Status | Borrower | Loan Amount |
|---|---|---|---|
| Closed | Marzano Joseph C | $172,000 | |
| Closed | Calcagno Cara | $138,500 |
Source: Public Records
Tax History Compared to Growth
Tax History
| Year | Tax Paid | Tax Assessment Tax Assessment Total Assessment is a certain percentage of the fair market value that is determined by local assessors to be the total taxable value of land and additions on the property. | Land | Improvement |
|---|---|---|---|---|
| 2024 | $12,961 | $223,071 | $68,928 | $154,143 |
| 2023 | $12,037 | $206,280 | $63,740 | $142,540 |
| 2022 | $11,661 | $198,300 | $61,280 | $137,020 |
| 2021 | $11,373 | $193,370 | $59,760 | $133,610 |
| 2020 | $10,935 | $189,130 | $58,450 | $130,680 |
| 2019 | $10,706 | $179,810 | $55,570 | $124,240 |
| 2018 | $11,665 | $194,290 | $52,600 | $141,690 |
| 2017 | $11,414 | $185,140 | $50,120 | $135,020 |
| 2016 | $11,180 | $174,420 | $47,220 | $127,200 |
| 2015 | $11,076 | $162,490 | $43,990 | $118,500 |
| 2014 | $11,210 | $151,460 | $40,150 | $111,310 |
| 2013 | $11,087 | $153,600 | $40,720 | $112,880 |
Source: Public Records
Map
Nearby Homes
- 694 S York St
- 185 E Oneida Ave
- 680 S Bryan St
- 580 S Kearsage Ave
- 274 E Crescent Ave
- 142 E Quincy St
- 613 S Chatham Ave
- 611 S Prospect Ave
- 570 S Parkside Ave
- 15 Manchester Ln
- 500 S Kenilworth Ave
- 162 E Hale St
- 562 S Poplar Ave
- 341 E Madison St
- 28 Windsor Dr
- 618 S Swain Ave
- 762 S Saylor Ave
- 814 S Saylor Ave
- 900 S Colfax Ave
- 801 S Spring Rd