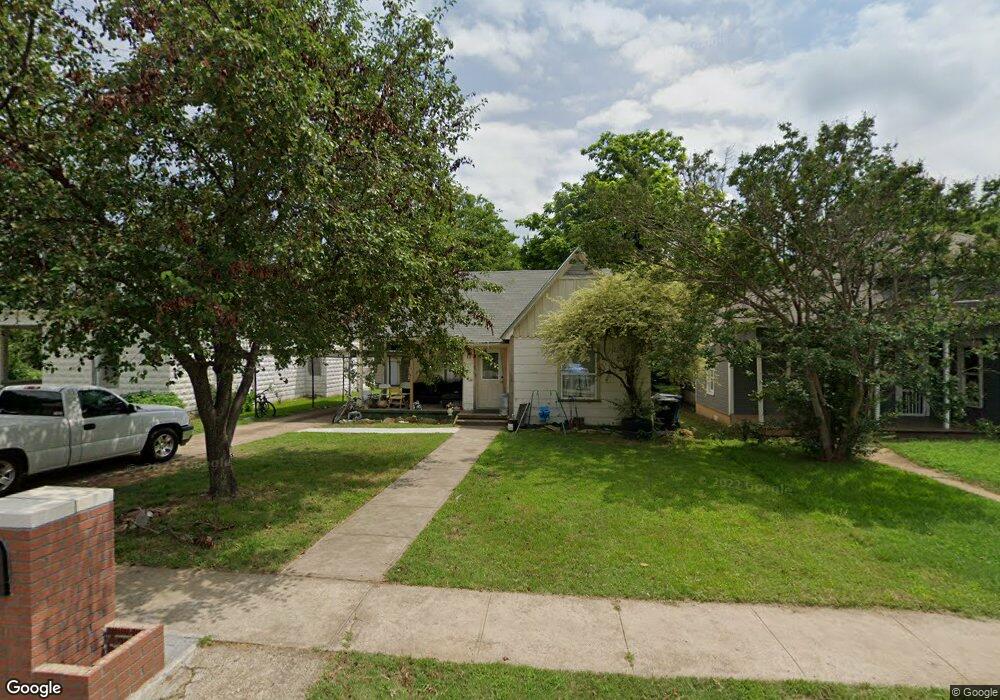
714 W Monterey St Denison, TX 75020
Estimated Value: $147,031 - $179,000
--
Bed
1
Bath
1,266
Sq Ft
$129/Sq Ft
Est. Value
About This Home
This home is located at 714 W Monterey St, Denison, TX 75020 and is currently estimated at $163,016, approximately $128 per square foot. 714 W Monterey St is a home located in Grayson County with nearby schools including Houston Elementary School, Scott Middle School, and Denison High School.
Ownership History
Date
Name
Owned For
Owner Type
Purchase Details
Closed on
Nov 13, 2020
Sold by
Vendo Casas Llc
Bought by
Barron Maria
Current Estimated Value
Home Financials for this Owner
Home Financials are based on the most recent Mortgage that was taken out on this home.
Original Mortgage
$85,000
Outstanding Balance
$75,638
Interest Rate
2.8%
Mortgage Type
New Conventional
Estimated Equity
$87,378
Purchase Details
Closed on
Sep 28, 2018
Sold by
Nelson Christine Dale
Bought by
Traweek Mark R and Traweek Britt E
Home Financials for this Owner
Home Financials are based on the most recent Mortgage that was taken out on this home.
Original Mortgage
$51,000
Interest Rate
4.5%
Mortgage Type
Purchase Money Mortgage
Purchase Details
Closed on
May 31, 2006
Sold by
Latona Brianne
Bought by
Traweek Mark
Home Financials for this Owner
Home Financials are based on the most recent Mortgage that was taken out on this home.
Original Mortgage
$40,500
Interest Rate
6.5%
Mortgage Type
Purchase Money Mortgage
Create a Home Valuation Report for This Property
The Home Valuation Report is an in-depth analysis detailing your home's value as well as a comparison with similar homes in the area
Home Values in the Area
Average Home Value in this Area
Purchase History
| Date | Buyer | Sale Price | Title Company |
|---|---|---|---|
| Barron Maria | -- | None Available | |
| Traweek Mark R | -- | Grayson County Title | |
| Traweek Mark | -- | None Available |
Source: Public Records
Mortgage History
| Date | Status | Borrower | Loan Amount |
|---|---|---|---|
| Open | Barron Maria | $85,000 | |
| Previous Owner | Traweek Mark R | $51,000 | |
| Previous Owner | Traweek Mark | $40,500 |
Source: Public Records
Tax History Compared to Growth
Tax History
| Year | Tax Paid | Tax Assessment Tax Assessment Total Assessment is a certain percentage of the fair market value that is determined by local assessors to be the total taxable value of land and additions on the property. | Land | Improvement |
|---|---|---|---|---|
| 2025 | $3,082 | $125,928 | $51,000 | $74,928 |
| 2024 | $3,082 | $132,661 | $58,875 | $73,786 |
| 2023 | $2,661 | $117,430 | $39,000 | $78,430 |
| 2022 | $2,595 | $109,200 | $39,000 | $70,200 |
| 2021 | $2,011 | $79,723 | $19,950 | $59,773 |
| 2020 | $1,940 | $80,639 | $15,000 | $65,639 |
| 2019 | $1,840 | $76,875 | $8,550 | $68,325 |
| 2018 | $1,686 | $63,106 | $7,275 | $55,831 |
| 2017 | $1,546 | $58,829 | $3,000 | $55,829 |
| 2016 | $1,405 | $50,234 | $2,700 | $47,534 |
| 2015 | $918 | $47,398 | $3,150 | $44,248 |
| 2014 | $1,059 | $47,099 | $3,150 | $43,949 |
Source: Public Records
Map
Nearby Homes
- 708 W Texas St
- TBD W Texas St
- 1401 W Texas St
- 0000 W Texas St
- 1011 S Armstrong Ave
- 615 W Texas St
- 704 W Hull St
- 701 W Hull St Unit 101-2
- 1301 S Scullin Ave
- 1007 S Scullin Ave
- 513 W Texas St
- 513 W Murray St
- 908 W Murray St
- 709 W Hanna St
- 621 W Munson St
- 509 W Acheson St
- 415 W Monterey St
- 408 W Heron St
- 901 W Munson St
- 525 W Hanna St
- 718 W Monterey St
- 710 W Monterey St
- 724 W Monterey St
- 726 W Monterey St
- 715 W Heron St
- 719 W Heron St
- 711 W Heron St
- 721 W Heron St
- 1208 S Armstrong Ave
- 715 W Monterey St
- 717 W Monterey St
- 709 W Monterey St
- 721 W Monterey St
- 705 W Monterey St
- 1220 S Armstrong Ave
- 731 W Monterey St
- 630 W Monterey St
- 701 W Monterey St
- 701 W Heron St
- 631 W Heron St