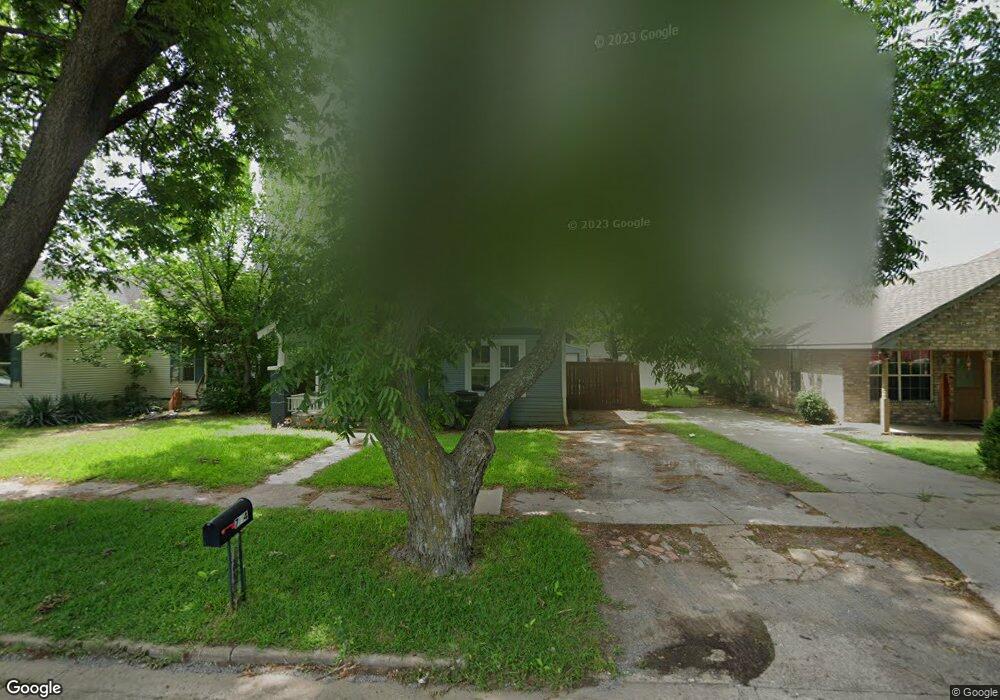
714 W Morgan St Denison, TX 75020
Estimated Value: $160,116 - $181,000
2
Beds
2
Baths
1,230
Sq Ft
$139/Sq Ft
Est. Value
About This Home
This home is located at 714 W Morgan St, Denison, TX 75020 and is currently estimated at $170,558, approximately $138 per square foot. 714 W Morgan St is a home located in Grayson County with nearby schools including Terrell Elementary School, Scott Middle School, and Denison High School.
Ownership History
Date
Name
Owned For
Owner Type
Purchase Details
Closed on
Oct 25, 2022
Sold by
Frick Jo Ann and Mitchell Sylvia F
Bought by
Mitchell Sylvia F
Current Estimated Value
Purchase Details
Closed on
Mar 19, 2019
Sold by
Mitchell Donna L
Bought by
Frick Jo Ann and Mitchell Sylvia F
Purchase Details
Closed on
Oct 16, 2007
Sold by
Swartz & Brough Inc
Bought by
Mitchell Donna L
Home Financials for this Owner
Home Financials are based on the most recent Mortgage that was taken out on this home.
Original Mortgage
$30,800
Interest Rate
6.47%
Purchase Details
Closed on
Sep 6, 2007
Sold by
Beatty C M and Beatty Margaret
Bought by
Swartz & Brough Inc
Home Financials for this Owner
Home Financials are based on the most recent Mortgage that was taken out on this home.
Original Mortgage
$30,800
Interest Rate
6.47%
Create a Home Valuation Report for This Property
The Home Valuation Report is an in-depth analysis detailing your home's value as well as a comparison with similar homes in the area
Home Values in the Area
Average Home Value in this Area
Purchase History
| Date | Buyer | Sale Price | Title Company |
|---|---|---|---|
| Mitchell Sylvia F | -- | None Listed On Document | |
| Frick Jo Ann | -- | None Available | |
| Mitchell Donna L | -- | Chapin Title Co Inc | |
| Swartz & Brough Inc | -- | Chapin Title Co Inc |
Source: Public Records
Mortgage History
| Date | Status | Borrower | Loan Amount |
|---|---|---|---|
| Previous Owner | Mitchell Donna L | $30,800 |
Source: Public Records
Tax History Compared to Growth
Tax History
| Year | Tax Paid | Tax Assessment Tax Assessment Total Assessment is a certain percentage of the fair market value that is determined by local assessors to be the total taxable value of land and additions on the property. | Land | Improvement |
|---|---|---|---|---|
| 2025 | $3,285 | $134,830 | $51,000 | $83,830 |
| 2024 | $3,285 | $141,382 | $58,875 | $82,507 |
| 2023 | $2,867 | $126,531 | $39,000 | $87,531 |
| 2022 | $2,790 | $117,427 | $39,000 | $78,427 |
| 2021 | $2,076 | $82,317 | $19,950 | $62,367 |
| 2020 | $2,201 | $83,432 | $15,000 | $68,432 |
| 2019 | $1,646 | $59,832 | $8,550 | $51,282 |
| 2018 | $1,672 | $60,287 | $7,275 | $53,012 |
| 2017 | $1,453 | $51,938 | $3,975 | $47,963 |
| 2016 | $1,485 | $53,064 | $4,500 | $48,564 |
| 2015 | $1,135 | $40,184 | $3,150 | $37,034 |
| 2014 | $1,135 | $40,184 | $3,150 | $37,034 |
Source: Public Records
Map
Nearby Homes
- 609 W Owing St
- 702 S Barrett Ave
- 831 W Owing St
- 705 W Crawford St
- 826 W Crawford St
- 830 W Shepherd St
- 920 W Morgan St
- 618 W Chestnut St
- 904 W Shepherd St
- 627 W Chestnut St
- 919 W Day St
- 621 W Munson St
- 901 W Munson St
- TBD W Main St
- 330 W Morgan St
- 511 W Munson St
- 326-328 W Morgan St
- 1027 W Crawford St
- 701 W Hull St Unit 101-2
- 408 W Day St
- 710 W Morgan St
- 716 W Morgan St
- 706 W Morgan St
- 722 W Morgan St
- 700 W Morgan St
- 511 S Barrett Ave
- 520 S Armstrong Ave
- 715 W Morgan St
- 709 W Morgan St
- 705 W Morgan St
- 701 W Morgan St
- 500 S Barrett Ave
- 631 W Morgan St
- 627 W Morgan St
- 710 W Owing St
- 718 W Owing St
- 624 W Morgan St
- 722 W Owing St
- 706 W Owing St
- 710 W Owings St