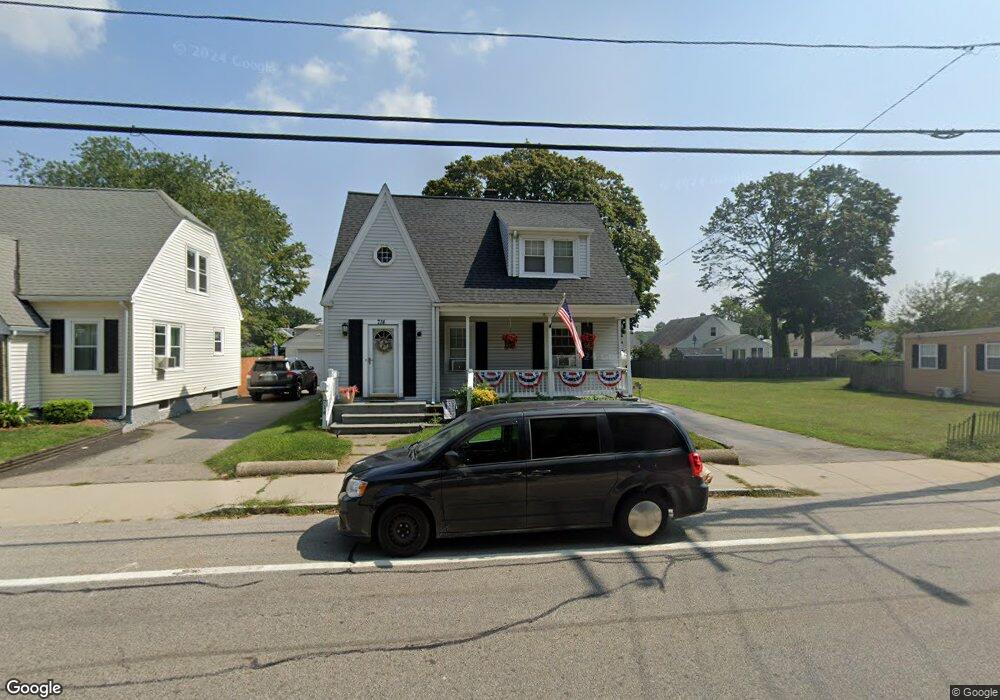
714 Willett Ave Riverside, RI 02915
Riverside NeighborhoodEstimated Value: $437,569 - $497,000
3
Beds
1
Bath
1,660
Sq Ft
$282/Sq Ft
Est. Value
About This Home
This home is located at 714 Willett Ave, Riverside, RI 02915 and is currently estimated at $468,142, approximately $282 per square foot. 714 Willett Ave is a home located in Providence County with nearby schools including East Providence High School, St Luke Elementary School, and St Mary Academy-Bay View.
Ownership History
Date
Name
Owned For
Owner Type
Purchase Details
Closed on
Jul 3, 2000
Sold by
Licata Paul A and Licata Diane
Bought by
Pine Jeannette M
Current Estimated Value
Purchase Details
Closed on
Jun 28, 1993
Sold by
Eddy Jean C
Bought by
Licata Paul A and Licata Diane
Create a Home Valuation Report for This Property
The Home Valuation Report is an in-depth analysis detailing your home's value as well as a comparison with similar homes in the area
Home Values in the Area
Average Home Value in this Area
Purchase History
| Date | Buyer | Sale Price | Title Company |
|---|---|---|---|
| Pine Jeannette M | $113,000 | -- | |
| Licata Paul A | $104,000 | -- | |
| Pine Jeannette M | $113,000 | -- | |
| Licata Paul A | $104,000 | -- |
Source: Public Records
Mortgage History
| Date | Status | Borrower | Loan Amount |
|---|---|---|---|
| Open | Licata Paul A | $192,000 | |
| Closed | Licata Paul A | $45,000 |
Source: Public Records
Tax History Compared to Growth
Tax History
| Year | Tax Paid | Tax Assessment Tax Assessment Total Assessment is a certain percentage of the fair market value that is determined by local assessors to be the total taxable value of land and additions on the property. | Land | Improvement |
|---|---|---|---|---|
| 2025 | $5,255 | $402,100 | $117,400 | $284,700 |
| 2024 | $5,145 | $335,600 | $97,800 | $237,800 |
| 2023 | $4,953 | $335,600 | $97,800 | $237,800 |
| 2022 | $4,440 | $203,100 | $55,700 | $147,400 |
| 2021 | $4,367 | $203,100 | $53,100 | $150,000 |
| 2020 | $4,182 | $203,100 | $53,100 | $150,000 |
| 2019 | $4,066 | $203,100 | $53,100 | $150,000 |
| 2018 | $3,860 | $168,700 | $51,600 | $117,100 |
| 2017 | $3,774 | $168,700 | $51,600 | $117,100 |
| 2016 | $3,755 | $168,700 | $51,600 | $117,100 |
| 2015 | $3,876 | $168,900 | $47,800 | $121,100 |
| 2014 | $3,876 | $168,900 | $47,800 | $121,100 |
Source: Public Records
Map
Nearby Homes