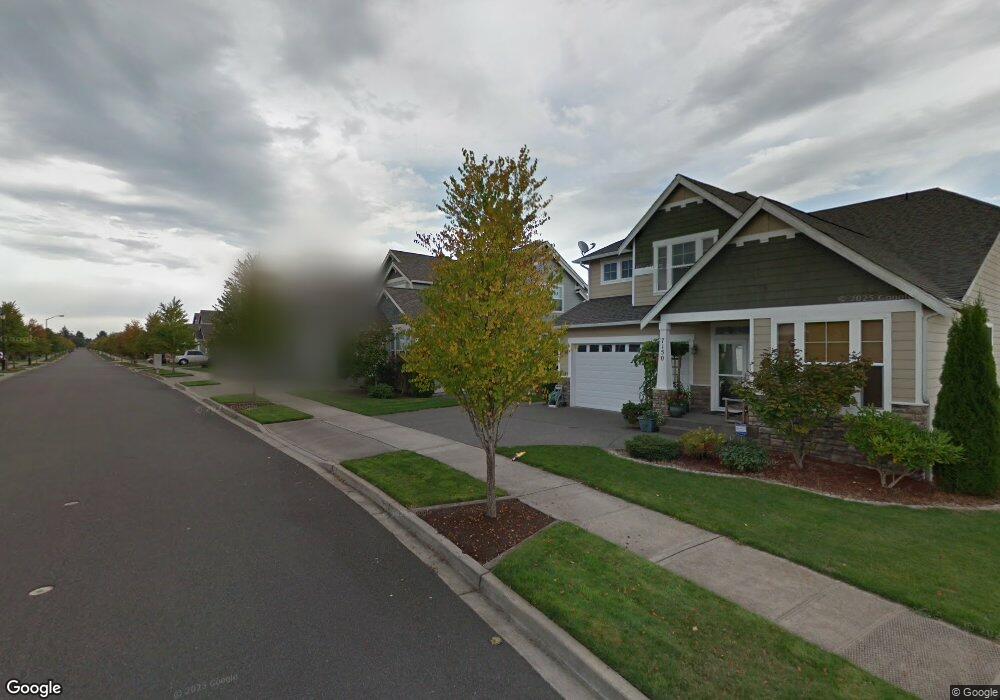
7142 Axis St SE Lacey, WA 98513
Horizon Pointe NeighborhoodEstimated Value: $518,657 - $551,000
4
Beds
3
Baths
2,217
Sq Ft
$242/Sq Ft
Est. Value
About This Home
This home is located at 7142 Axis St SE, Lacey, WA 98513 and is currently estimated at $536,914, approximately $242 per square foot. 7142 Axis St SE is a home located in Thurston County with nearby schools including Horizons Elementary School, Komachin Middle School, and Timberline High School.
Ownership History
Date
Name
Owned For
Owner Type
Purchase Details
Closed on
Aug 28, 2024
Sold by
2024-1 Ih Borrower Lp
Bought by
2024-1 Ih Borrower Lp
Current Estimated Value
Home Financials for this Owner
Home Financials are based on the most recent Mortgage that was taken out on this home.
Original Mortgage
$891,909,000
Outstanding Balance
$879,041,465
Interest Rate
6.73%
Mortgage Type
New Conventional
Estimated Equity
-$878,504,551
Purchase Details
Closed on
Jul 22, 2021
Sold by
Hall Rux Jaye
Bought by
Sfr Javelin Borrower Lp
Purchase Details
Closed on
Aug 5, 2010
Sold by
Hall Heather N
Bought by
Hall Rux Jaye
Purchase Details
Closed on
May 8, 2007
Sold by
Afford A Home Inc
Bought by
Hall Rux and Hall Heather
Home Financials for this Owner
Home Financials are based on the most recent Mortgage that was taken out on this home.
Original Mortgage
$290,412
Interest Rate
6.14%
Mortgage Type
VA
Create a Home Valuation Report for This Property
The Home Valuation Report is an in-depth analysis detailing your home's value as well as a comparison with similar homes in the area
Home Values in the Area
Average Home Value in this Area
Purchase History
| Date | Buyer | Sale Price | Title Company |
|---|---|---|---|
| 2024-1 Ih Borrower Lp | -- | None Listed On Document | |
| Sfr Javelin Borrower Lp | $490,000 | Chicago Title Company Of Wa | |
| Hall Rux Jaye | -- | None Available | |
| Hall Rux | $284,300 | First American Title |
Source: Public Records
Mortgage History
| Date | Status | Borrower | Loan Amount |
|---|---|---|---|
| Open | 2024-1 Ih Borrower Lp | $891,909,000 | |
| Previous Owner | Hall Rux | $290,412 |
Source: Public Records
Tax History
| Year | Tax Paid | Tax Assessment Tax Assessment Total Assessment is a certain percentage of the fair market value that is determined by local assessors to be the total taxable value of land and additions on the property. | Land | Improvement |
|---|---|---|---|---|
| 2025 | $4,435 | $489,100 | $119,900 | $369,200 |
| 2024 | $4,435 | $486,500 | $115,400 | $371,100 |
| 2023 | $4,435 | $463,800 | $96,200 | $367,600 |
| 2022 | $4,111 | $456,900 | $57,300 | $399,600 |
| 2021 | $3,775 | $353,300 | $59,500 | $293,800 |
| 2020 | $3,534 | $302,200 | $62,200 | $240,000 |
| 2019 | $2,994 | $293,900 | $50,800 | $243,100 |
| 2018 | $3,439 | $256,100 | $39,600 | $216,500 |
| 2017 | $2,972 | $233,150 | $39,550 | $193,600 |
| 2016 | $2,743 | $223,300 | $38,700 | $184,600 |
| 2014 | -- | $209,800 | $37,100 | $172,700 |
Source: Public Records
Map
Nearby Homes
- 7027 Bailey St SE
- 6977 Flute St SE
- 5307 Balustrade Blvd SE
- 4527 Prestwick Ln SE
- 5107 66th Ave SE
- 4442 Prestwick Ln SE
- 6611 Millstone Ln SE Unit F101
- 6626 Millstone Ln SE Unit M102
- 5805 Pennsylvania St SE
- 5808 Pennsylvania St SE
- 7842 Diagonal Rd SE
- 6109 Armour St SE
- 4120 Stonehaven Ln SE
- 6531 Indiana St SE
- 7900 Diagonal Rd SE
- 4112 Stonehaven Ln SE
- 6003 Armour Loop SE
- 6520 Indiana St SE
- 6509 Oklahoma St SE
- 6039 Merlot Ln SE Unit 6039
- 7134 Axis St SE
- 7150 Axis St SE
- 7145 Inlay St SE
- 7153 Inlay St SE
- 7126 Axis St SE
- 7137 Inlay St SE
- 7161 Inlay St SE
- 7141 Axis St SE
- 7149 Axis St SE
- 7129 Inlay St SE
- 7133 Axis St SE
- 7118 Axis St SE
- 7125 Axis St SE
- 7629 Inlay Street Se (Lot 752hp) SE
- 7121 Inlay St SE
- 7173 Radius Loop SE
- 7177 Radius Loop SE
- 7169 Radius Loop SE
- 7110 Axis St SE
- 7181 Radius Loop SE
Your Personal Tour Guide
Ask me questions while you tour the home.