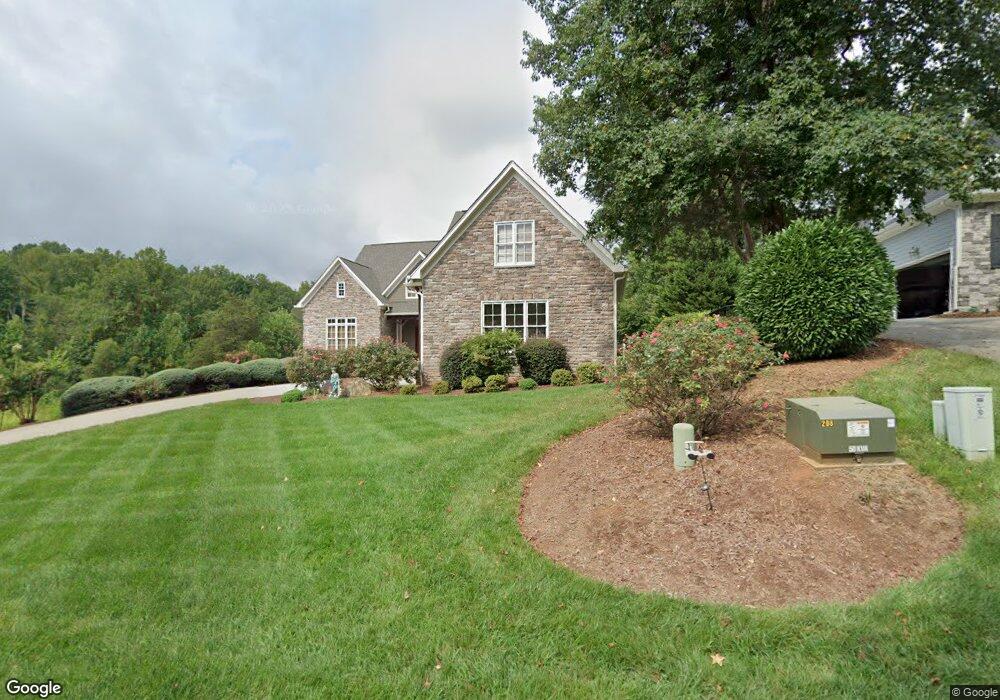
7149 Inverness Dr Denver, NC 28037
Estimated Value: $903,609 - $1,085,000
5
Beds
4
Baths
4,041
Sq Ft
$237/Sq Ft
Est. Value
About This Home
This home is located at 7149 Inverness Dr, Denver, NC 28037 and is currently estimated at $957,402, approximately $236 per square foot. 7149 Inverness Dr is a home located in Lincoln County with nearby schools including St. James Elementary School, East Lincoln Middle School, and East Lincoln High School.
Ownership History
Date
Name
Owned For
Owner Type
Purchase Details
Closed on
Apr 18, 2018
Sold by
Sinclair Ronald J and Sinclair Marion
Bought by
Schmiedel John T and Schmiedel Catherine W
Current Estimated Value
Purchase Details
Closed on
Nov 15, 2011
Sold by
Branch Banking & Trust Company
Bought by
Sinclair Ronald J and Sinclair Marion
Home Financials for this Owner
Home Financials are based on the most recent Mortgage that was taken out on this home.
Original Mortgage
$200,000
Interest Rate
4.09%
Mortgage Type
New Conventional
Purchase Details
Closed on
Aug 15, 2011
Sold by
Collins Joseph and Collins Linda
Bought by
Branch Banking & Trust Company
Purchase Details
Closed on
Jan 8, 2008
Sold by
Knox H Edward H and Knox Frances S
Bought by
Collins Joseph and Collins Linda
Home Financials for this Owner
Home Financials are based on the most recent Mortgage that was taken out on this home.
Original Mortgage
$620,000
Interest Rate
6.37%
Mortgage Type
Construction
Create a Home Valuation Report for This Property
The Home Valuation Report is an in-depth analysis detailing your home's value as well as a comparison with similar homes in the area
Home Values in the Area
Average Home Value in this Area
Purchase History
| Date | Buyer | Sale Price | Title Company |
|---|---|---|---|
| Schmiedel John T | $618,000 | None Available | |
| Sinclair Ronald J | $374,000 | None Available | |
| Branch Banking & Trust Company | $289,000 | None Available | |
| Collins Joseph | $120,000 | None Available |
Source: Public Records
Mortgage History
| Date | Status | Borrower | Loan Amount |
|---|---|---|---|
| Previous Owner | Sinclair Ronald J | $200,000 | |
| Previous Owner | Collins Joseph | $620,000 |
Source: Public Records
Tax History Compared to Growth
Tax History
| Year | Tax Paid | Tax Assessment Tax Assessment Total Assessment is a certain percentage of the fair market value that is determined by local assessors to be the total taxable value of land and additions on the property. | Land | Improvement |
|---|---|---|---|---|
| 2025 | $4,975 | $799,191 | $126,000 | $673,191 |
| 2024 | $4,939 | $799,191 | $126,000 | $673,191 |
| 2023 | $4,934 | $799,191 | $126,000 | $673,191 |
| 2022 | $3,983 | $522,024 | $100,000 | $422,024 |
| 2021 | $3,947 | $522,024 | $100,000 | $422,024 |
| 2020 | $3,727 | $522,024 | $100,000 | $422,024 |
| 2019 | $3,727 | $522,024 | $100,000 | $422,024 |
| 2018 | $3,332 | $445,027 | $98,500 | $346,527 |
| 2017 | $3,231 | $445,027 | $98,500 | $346,527 |
| 2016 | $3,220 | $445,027 | $98,500 | $346,527 |
| 2015 | $3,383 | $445,027 | $98,500 | $346,527 |
| 2014 | $3,248 | $434,952 | $100,750 | $334,202 |
Source: Public Records
Map
Nearby Homes
- 1567 Withers Dr
- 1775 Mount Carmel Cir
- 1763 Mount Carmel Cir
- 1791 Withers Dr
- 2273 Pine Valley Dr
- 7245 Willow Brook Ct
- 1487 Winged Foot Dr
- 7246 Windy Ridge Dr
- 1486 Winged Foot Dr
- 1038 Misty Creek Dr Unit 38
- 1207 Misty Creek Dr
- 1515 Baltusrol Dr
- 1063 Ventosa Dr
- Lot 6 Jerry Ross Ln
- 000 Verdict Ridge Dr Unit 284
- 1365 Winged Foot Dr
- 7362 Hemlock Ct
- 1064 Ventosa Dr
- 1376 Winged Foot Dr
- 2A Ventosa Dr
- 7159 Inverness Dr
- 7167 Inverness Dr
- 1659 Royal Troon Ct
- 7156 Inverness Dr
- 1652 Royal Troon Ct
- 1653 Royal Troon Ct
- L370 Royal Troon Ct Unit Lot 370
- 7179 Inverness Dr
- 364 Royal Troon Ct
- 364 Royal Troon Ct Unit Lot 364
- 1646 Royal Troon Ct
- 367 Royal Troon Ct
- 363 Royal Troon Ct
- LT369 Royal Troon Ct Unit Lot 369
- 1705 Withers Dr
- 1640 Royal Troon Ct
- Lot364 Royal Troon Ct Unit Lot 364
- 362 Royal Troon Ct
- #370 Royal Troon Ct
- lot370 Royal Troon Ct Unit 370