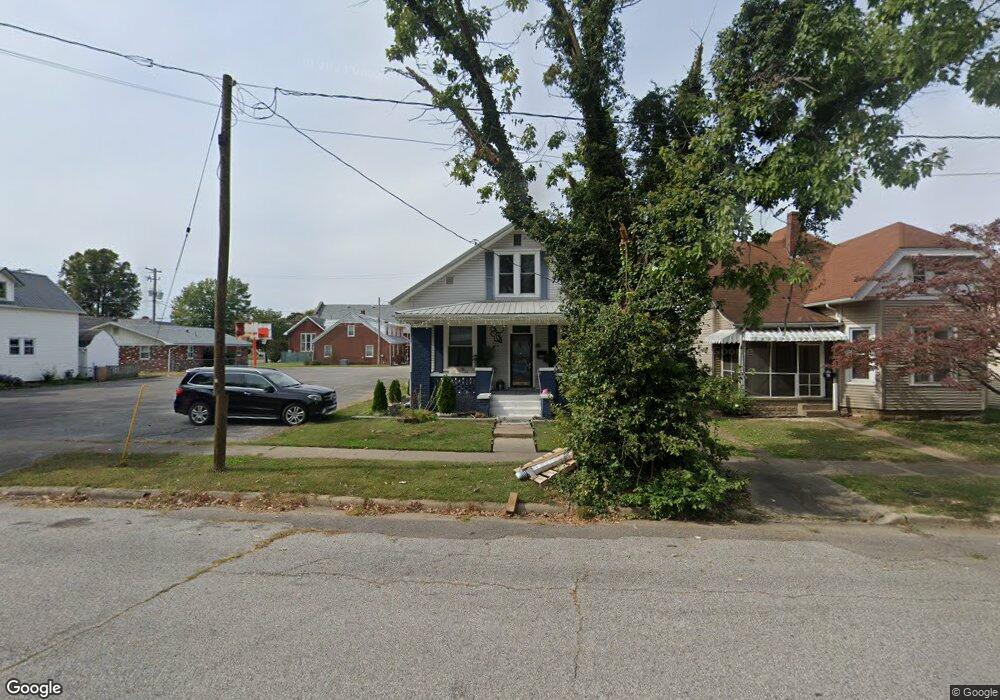
715 11th St Tell City, IN 47586
Estimated Value: $119,655 - $184,000
4
Beds
1
Bath
3,512
Sq Ft
$44/Sq Ft
Est. Value
About This Home
This home is located at 715 11th St, Tell City, IN 47586 and is currently estimated at $154,914, approximately $44 per square foot. 715 11th St is a home located in Perry County with nearby schools including William Tell Elementary School, Tell City Junior/Senior High School, and Agape Christian Academy.
Ownership History
Date
Name
Owned For
Owner Type
Purchase Details
Closed on
Jan 31, 2017
Sold by
Patrick Avis A and Patrick Gary A
Bought by
Mata Maria E
Current Estimated Value
Home Financials for this Owner
Home Financials are based on the most recent Mortgage that was taken out on this home.
Original Mortgage
$33,393
Outstanding Balance
$27,725
Interest Rate
4.3%
Mortgage Type
Commercial
Estimated Equity
$127,189
Create a Home Valuation Report for This Property
The Home Valuation Report is an in-depth analysis detailing your home's value as well as a comparison with similar homes in the area
Home Values in the Area
Average Home Value in this Area
Purchase History
| Date | Buyer | Sale Price | Title Company |
|---|---|---|---|
| Mata Maria E | -- | None Available |
Source: Public Records
Mortgage History
| Date | Status | Borrower | Loan Amount |
|---|---|---|---|
| Open | Mata Maria E | $33,393 |
Source: Public Records
Tax History Compared to Growth
Tax History
| Year | Tax Paid | Tax Assessment Tax Assessment Total Assessment is a certain percentage of the fair market value that is determined by local assessors to be the total taxable value of land and additions on the property. | Land | Improvement |
|---|---|---|---|---|
| 2024 | $1,720 | $85,300 | $6,200 | $79,100 |
| 2023 | $1,477 | $73,200 | $6,200 | $67,000 |
| 2022 | $1,272 | $63,000 | $6,200 | $56,800 |
| 2021 | $1,154 | $57,100 | $5,200 | $51,900 |
| 2020 | $1,082 | $53,500 | $5,200 | $48,300 |
| 2019 | $1,026 | $50,700 | $5,000 | $45,700 |
| 2018 | $1,018 | $50,300 | $5,000 | $45,300 |
| 2017 | $462 | $62,600 | $5,000 | $57,600 |
| 2016 | $462 | $62,000 | $5,000 | $57,000 |
| 2014 | $467 | $59,600 | $5,200 | $54,400 |
| 2013 | $467 | $59,100 | $5,200 | $53,900 |
Source: Public Records
Map
Nearby Homes