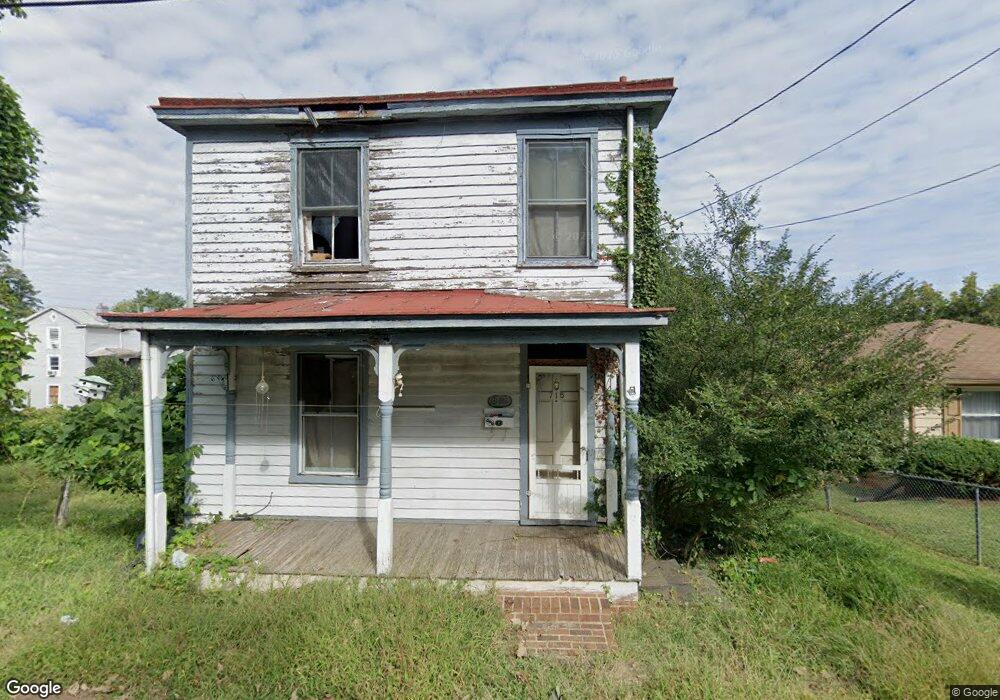
715 1st St Lynchburg, VA 24504
Tinbridge Hill NeighborhoodEstimated Value: $84,937 - $159,000
--
Bed
1
Bath
1,134
Sq Ft
$101/Sq Ft
Est. Value
About This Home
This home is located at 715 1st St, Lynchburg, VA 24504 and is currently estimated at $113,984, approximately $100 per square foot. 715 1st St is a home located in Lynchburg City with nearby schools including Bedford Hills Elementary School, Linkhorne Middle School, and E.C. Glass High School.
Ownership History
Date
Name
Owned For
Owner Type
Purchase Details
Closed on
May 24, 2018
Sold by
Danvers Daniel A and Raghavan Sarita M
Bought by
Deboer James
Current Estimated Value
Purchase Details
Closed on
Jan 3, 2006
Sold by
Danvers Daniel A
Bought by
Danvers Daniel A and Raghaven Sarita M
Purchase Details
Closed on
Aug 19, 2005
Sold by
Abranovich Theo S and Lehman Kenneth
Bought by
Danvers Daniel A
Home Financials for this Owner
Home Financials are based on the most recent Mortgage that was taken out on this home.
Original Mortgage
$45,050
Interest Rate
9.95%
Mortgage Type
Adjustable Rate Mortgage/ARM
Create a Home Valuation Report for This Property
The Home Valuation Report is an in-depth analysis detailing your home's value as well as a comparison with similar homes in the area
Home Values in the Area
Average Home Value in this Area
Purchase History
| Date | Buyer | Sale Price | Title Company |
|---|---|---|---|
| Deboer James | $7,600 | None Available | |
| Danvers Daniel A | -- | None Available | |
| Danvers Daniel A | -- | None Available |
Source: Public Records
Mortgage History
| Date | Status | Borrower | Loan Amount |
|---|---|---|---|
| Previous Owner | Danvers Daniel A | $45,050 |
Source: Public Records
Tax History Compared to Growth
Tax History
| Year | Tax Paid | Tax Assessment Tax Assessment Total Assessment is a certain percentage of the fair market value that is determined by local assessors to be the total taxable value of land and additions on the property. | Land | Improvement |
|---|---|---|---|---|
| 2025 | $293 | $34,900 | $15,000 | $19,900 |
| 2024 | $288 | $32,400 | $17,500 | $14,900 |
| 2023 | $288 | $32,400 | $17,500 | $14,900 |
| 2022 | $236 | $22,900 | $10,000 | $12,900 |
| 2021 | $254 | $22,900 | $10,000 | $12,900 |
| 2020 | $273 | $24,600 | $7,500 | $17,100 |
| 2019 | $273 | $24,600 | $7,500 | $17,100 |
| 2018 | $531 | $47,800 | $6,300 | $41,500 |
| 2017 | $531 | $47,800 | $6,300 | $41,500 |
| 2016 | $531 | $47,800 | $6,300 | $41,500 |
| 2015 | $531 | $53,900 | $6,300 | $47,600 |
| 2014 | $598 | $53,900 | $6,300 | $47,600 |
Source: Public Records
Map
Nearby Homes